# 从 Cloudflare Workers 写入 GreptimeDB:边缘遥测的 HTTP 写 + SQL 读方案
Source: https://greptime.cn/blogs/2026-04-26-cloudflare-workers-greptimedb-edge-analytics
[Cloudflare Workers](https://developers.cloudflare.com/workers/) 让你的代码运行在边缘——靠近用户,分布在 Cloudflare 的全球网络上,启动时间亚毫秒级。如果你还没用过,可以把 Workers 理解为运行在 V8 隔离环境(而不是容器)里的轻量级 Serverless 函数。它们很适合做请求路由、API 后端和中间件,但也有自身的约束:每次调用生命周期短,没有传统的服务器进程,运行时和 Node.js 也有不少差异。
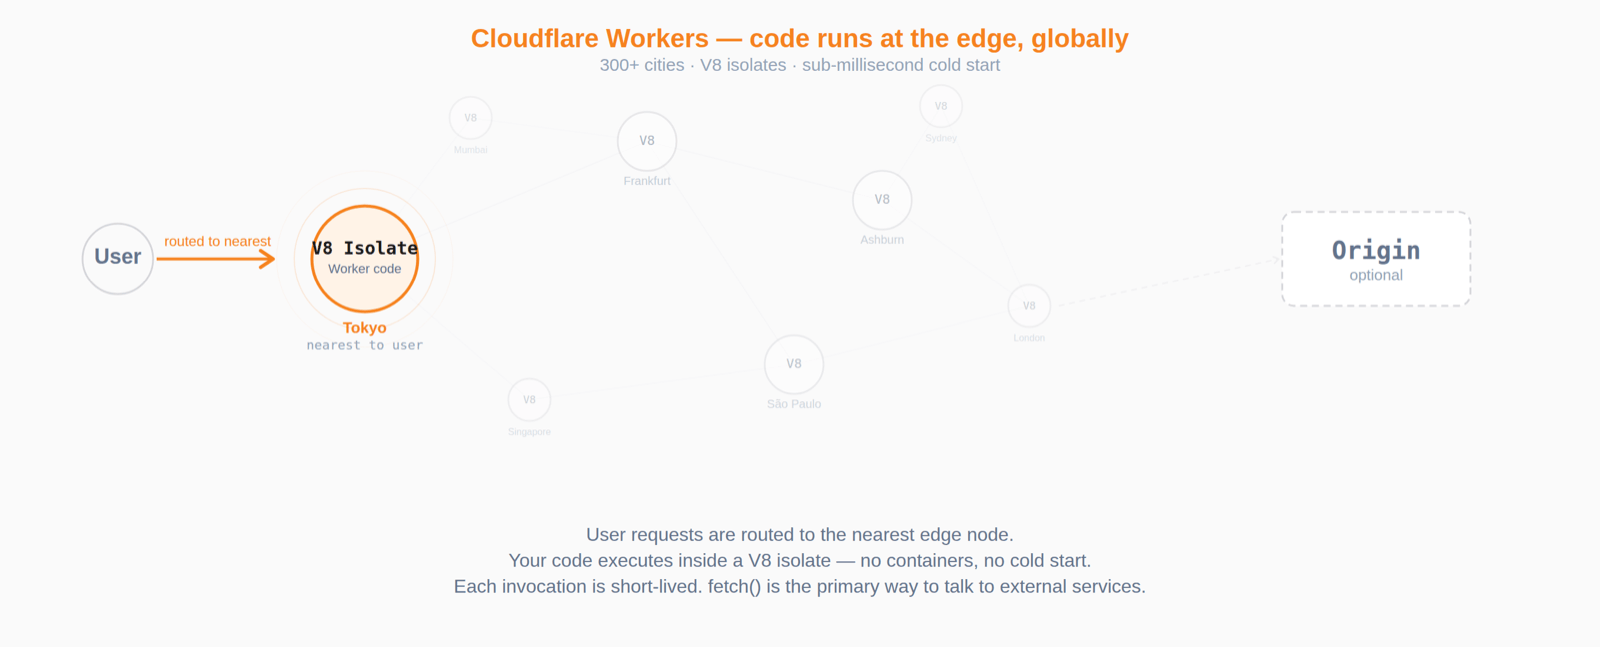 用户请求被路由到最近的边缘节点,Worker 代码在 V8 隔离环境中执行。
当你需要记录 Worker 做了什么——请求日志、延迟指标、错误追踪——Cloudflare 内置的选项往往不够用。[D1](https://developers.cloudflare.com/d1/) 是边缘的 SQLite,面向关系型应用数据,不是为高流量时序写入设计的。[Workers Analytics Engine](https://developers.cloudflare.com/analytics/analytics-engine/) 提供轻量分析,但有基数限制并且使用有损采样——你没法对原始事件跑任意 SQL。两者都没法给你一个"全量事件存储 + 灵活查询"的体验。
GreptimeDB 补上了这个空缺。它通过 HTTP 接收写入(InfluxDB 行协议),通过 PostgreSQL 线协议提供读取。两种协议都能从 Workers 里用:写入用 `fetch()`,读取走 [Cloudflare Hyperdrive](https://developers.cloudflare.com/hyperdrive/) 的连接池。本文带你走完整个流程:从 Worker 写入请求事件到 GreptimeDB,查询数据,再用 Grafana 做仪表盘。
如果你看过我们的 [Tensor Fusion 用户故事](/blogs/tensor-fusion-greptimedb-user-story),可能还记得他们的团队在从 Cloudflare Workers 用标准 PostgreSQL 驱动连接 GreptimeDB 时碰了壁——Workers 运行时不像 Node.js 那样支持任意的出站 TCP 连接。Hyperdrive 是他们找到的解决方案,本文展示的正是这个模式的完整实现。
我们用一个完整的 [demo](https://github.com/GreptimeTeam/demo-scene/tree/main/cloudflare-workers) 演示,全部跑在 `docker compose` 里。先在本地跟着做,之后可以把同一个 Worker 部署到 Cloudflare 的边缘网络。
## 架构
整体设计把读写拆成两条路径,各自用一种在 Workers 里好用的协议:
```
┌──────────────┐
│ Client │
└──────┬───────┘
│ request
▼
┌──────────────┐ POST /v1/influxdb/... ┌──────────────┐
│ Cloudflare │ ─────── 写入路径 ──────────────▶ │ GreptimeDB │
│ Worker │ │ │
│ │ ◀────── 读取路径 ─────────────── │ │
└──────────────┘ Hyperdrive + postgres.js └──────────────┘
(PG wire)
```
写入路径:Worker 构建 InfluxDB 行协议字符串,用 `fetch()` POST 到 GreptimeDB 的 HTTP 端点。虽然 Workers 也支持通过 [`cloudflare:sockets`](https://developers.cloudflare.com/workers/runtime-apis/tcp-sockets/) 发起 TCP 连接,但 HTTP 更简单,不需要管理连接生命周期。
读取路径:Worker 通过 [Hyperdrive](https://developers.cloudflare.com/hyperdrive/) 访问 GreptimeDB 的 PostgreSQL 线协议接口。Hyperdrive 在靠近数据库的位置维护连接池,Worker 每次调用不用重复做握手。客户端用 [`postgres.js`](https://github.com/porsager/postgres),这也是 [Hyperdrive 文档](https://developers.cloudflare.com/hyperdrive/examples/connect-to-postgres/postgres-drivers-and-libraries/postgres-js/)列出的支持驱动。
## 快速开始
```bash
git clone https://github.com/GreptimeTeam/demo-scene.git
cd demo-scene/cloudflare-workers
docker compose up -d
```
这会启动 GreptimeDB(HTTP :4000 / PG wire :4003)、一个本地 httpbin origin、跑在 [`wrangler dev`](https://developers.cloudflare.com/workers/wrangler/commands/#dev) 下的 Worker(:8787)以及预配置了仪表盘的 Grafana(:3000)。
发一些请求,然后查询:
```bash
curl http://localhost:8787/anything
curl http://localhost:8787/status/404
for i in {1..100}; do curl -s http://localhost:8787/anything?i=$i > /dev/null; done
```
```bash
# 通过 Worker 的读取路径查询
curl "http://localhost:8787/_stats?window=5" | jq
```
`_stats` 输出:
```json
{
"colo": "LAX",
"window_minutes": 5,
"rows": [
{
"path_group": "/anything",
"requests": "100",
"p95_ms": 1,
"errors": "0"
},
{
"path_group": "/status/:id",
"requests": "1",
"p95_ms": 1,
"errors": "1"
}
]
}
```
打开 Grafana `http://localhost:3000`,**Edge Traffic** 仪表盘实时显示请求量、延迟分位数和错误分布。
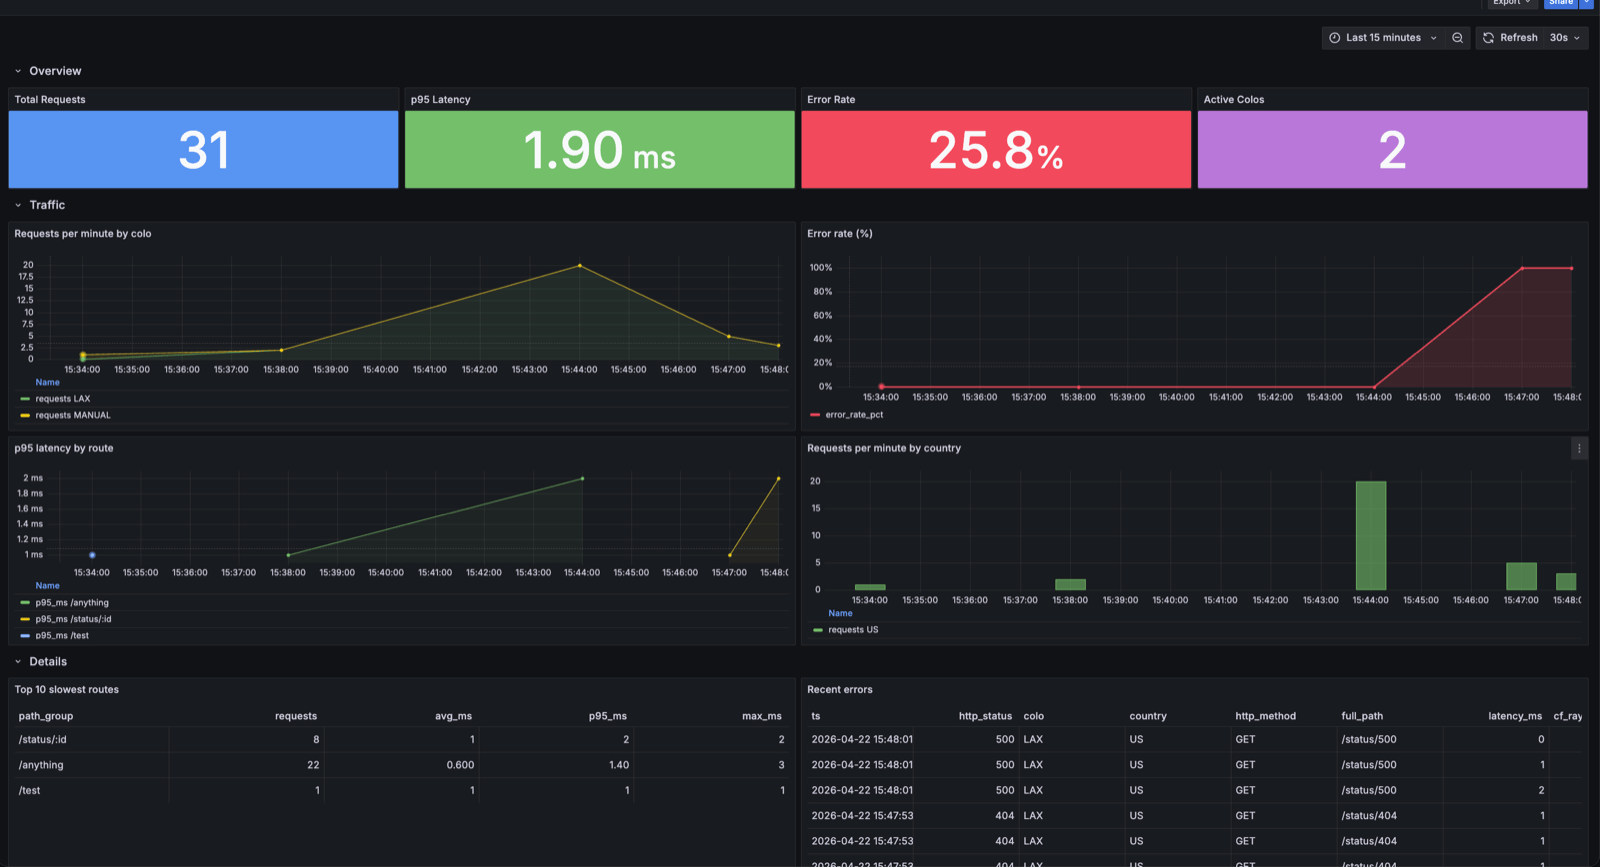 Edge Traffic 仪表盘:请求量、p95 延迟、错误率和最慢路由。
## 写入路径:InfluxDB 行协议 over HTTP
Workers 运行在 V8 隔离环境中,HTTP `fetch()` 是最自然的网络方式。GreptimeDB 的 [InfluxDB 兼容端点](https://docs.greptime.cn/user-guide/protocols/influxdb-line-protocol)通过 HTTP 接受行协议,不需要额外的客户端库。
我们用 `@influxdata/influxdb-client-browser` 包的 `Point` 类做行协议序列化(SDK 自带的 `WriteApi` 在 Workers 里会静默吞掉写入),然后用 `fetch()` 直接 POST:
```typescript
import { Point } from "@influxdata/influxdb-client-browser";
async function logEvent(
env: Env,
req: Request,
res: Response,
latencyMs: number
): Promise {
const cf = req.cf;
const colo = (cf?.colo as string) ?? "DEV";
const country = (cf?.country as string) ?? "XX";
const pathGroup = normalizePathGroup(new URL(req.url).pathname);
const point = new Point("worker_events")
.tag("colo", colo)
.tag("country", country)
.tag("http_method", req.method)
.intField("http_status", res.status)
.floatField("latency_ms", latencyMs)
.stringField("path_group", pathGroup)
.stringField("cf_ray", req.headers.get("cf-ray") ?? "")
.timestamp(BigInt(Date.now()) * 1_000_000n); // 纳秒
const line = point.toLineProtocol();
if (!line) return;
const url = `${env.GREPTIME_URL}/v1/influxdb/api/v2/write`
+ `?org=greptime&bucket=${env.GREPTIME_DB}&precision=ns`;
await fetch(url, {
method: "POST",
headers: { "Content-Type": "text/plain; charset=utf-8" },
body: line,
});
}
```
几个要点:通过 InfluxDB 行协议写入时,GreptimeDB 会把标签(Tag)映射为主键列,所以只对低基数维度用标签(`colo`、`country`、`http_method`)。时间戳用 BigInt 从毫秒转纳秒。整个写入放到 [`ctx.waitUntil()`](https://developers.cloudflare.com/workers/runtime-apis/context/#waituntil) 里执行,不阻塞响应。
### 路径归一化
URL 里带的 ID(`/api/users/42`)会拉爆基数。Demo 里的 [`normalizePathGroup()`](https://github.com/GreptimeTeam/demo-scene/blob/main/cloudflare-workers/worker/src/index.ts) 把 UUID、数字 ID、长十六进制串分别折叠成 `:uuid`、`:id`、`:hex`。生产环境建议直接用路由框架的 pattern matcher。
### 认证
GreptimeDB 需要认证时,加 `Authorization: token user:pass` header。凭证存为 [Wrangler secret](https://developers.cloudflare.com/workers/configuration/secrets/)(`wrangler secret put GREPTIME_USERNAME`),详见 demo 源码。
## 读取路径:Hyperdrive + postgres.js
Worker 每次调用生命周期短,自己建连接每次都要付 TCP+TLS 握手开销。[Hyperdrive](https://developers.cloudflare.com/hyperdrive/concepts/how-hyperdrive-works/) 在靠近数据库的位置维护连接池解决了这个问题。GreptimeDB 支持 PostgreSQL 线协议,Hyperdrive [明确支持 PostgreSQL 兼容数据库](https://developers.cloudflare.com/hyperdrive/)(包括 CockroachDB、Timescale),GreptimeDB 适用于同样的模式。
连接 GreptimeDB 时,`postgres.js` 需要三个关键配置:
```typescript
const sql = postgres(env.HYPERDRIVE.connectionString, {
max: 5, // Workers 并发外部连接数限制
fetch_types: false, // 跳过 pg_type 引导查询(GreptimeDB 覆盖有限)
prepare: false, // 简单查询协议(GreptimeDB PG wire 兼容性所需)
});
```
`prepare: false` 配合 `sql.unsafe()` 发送原始 SQL 是目前最兼容的写法,PG wire 的兼容问题在 [GreptimeDB #8050](https://github.com/GreptimeTeam/greptimedb/issues/8050) 跟踪。
查询用标准 SQL 加 GreptimeDB 函数,比如 demo 里的 `/_stats` 端点用 `approx_percentile_cont()` 算 p95 延迟、用 `CASE WHEN` 做错误计数。完整代码见 [demo 源码](https://github.com/GreptimeTeam/demo-scene/blob/main/cloudflare-workers/worker/src/index.ts)。
## 表结构设计
```sql
CREATE TABLE IF NOT EXISTS worker_events (
ts TIMESTAMP(9) TIME INDEX,
colo STRING,
country STRING,
http_method STRING,
path_group STRING,
http_status BIGINT,
latency_ms DOUBLE,
bytes_out BIGINT,
cf_ray STRING,
ua STRING,
full_path STRING,
PRIMARY KEY (colo, country, http_method)
) WITH (ttl = '30d', append_mode = 'true');
```
`append_mode = 'true'` 是最关键的配置——不开的话,时间戳和主键值相同的两条请求会被去重合并。`ts` 实际精度是毫秒,突发流量下很容易碰撞。Append Only 模式保证每次写入都创建新行,对日志场景的性能也有帮助。
主键列在 `append_mode = 'true'` 下不再用于去重,只决定磁盘上的物理排序。GreptimeDB 按主键列从左到右排序,越靠前的列在等值过滤时效率越高。
`colo` 放第一位,因为最常见的查询都是按数据中心过滤(demo 里的 `/_stats?colo=LAX` 就是这种),`country` 和 `http_method` 作为下钻维度跟在后面。三列都是低基数(colo 几百、country 不到 300、method 个位数),组合后扇出可控,过滤一轮后数据量已经不大。是否把高基数列加进主键,取决于前面几列的过滤效果是否已经足够:加进去不会破坏聚簇,但会带来额外的存储开销。这里前三列的过滤已经够用,`path_group` 保留为字段列。`ttl = '30d'` 自动清理过期数据,高流量场景建议再加[数据分区](https://docs.greptime.cn/user-guide/deployments-administration/manage-data/table-sharding)。
## 常用查询
事件流入后,可以直接用 SQL 分析。两个典型例子:
**按数据中心统计每分钟请求量:**
```sql
SELECT
date_bin('1 minute'::INTERVAL, ts) AS minute,
colo,
count(*) AS requests
FROM worker_events
WHERE ts > now() - INTERVAL 1 HOUR
GROUP BY minute, colo
ORDER BY minute DESC;
```
**排查近期错误:**
```sql
SELECT ts, http_status, colo, full_path, latency_ms, cf_ray
FROM worker_events
WHERE http_status >= 400
AND ts > now() - INTERVAL 15 MINUTE
ORDER BY ts DESC
LIMIT 50;
```
更多查询示例(延迟分位数、错误率时间线等)见 demo 仓库的 [`queries.sql`](https://github.com/GreptimeTeam/demo-scene/blob/main/cloudflare-workers/queries.sql)。这些查询可以通过 GreptimeDB 的 HTTP API、PostgreSQL 线协议接口或 Grafana 执行。Demo 预配置了一个 Grafana 仪表盘(通过 [MySQL 协议](https://docs.greptime.cn/user-guide/protocols/mysql)连 GreptimeDB),启动后打开 `http://localhost:3000` 即可查看。
## Worker 配置
Worker 通过 `wrangler.toml`(或 [`wrangler.jsonc`](https://developers.cloudflare.com/workers/wrangler/configuration/))配置:
```toml
name = "greptime-edge-logger"
main = "src/index.ts"
compatibility_date = "2024-11-11"
compatibility_flags = ["nodejs_compat"]
[vars]
GREPTIME_URL = "http://greptimedb:4000"
GREPTIME_DB = "public"
ORIGIN_URL = "http://origin:8080"
MEASUREMENT = "worker_events"
[[hyperdrive]]
binding = "HYPERDRIVE"
# 仅本地 demo 占位,`wrangler deploy` 或部署生产前需替换为真实 Hyperdrive ID
id = "00000000000000000000000000000000"
localConnectionString = "postgres://greptime:greptime@greptimedb:4003/public"
```
[`nodejs_compat`](https://developers.cloudflare.com/workers/configuration/compatibility-flags/#nodejs-compatibility-flag) 是必须的,`postgres.js` 依赖 `node:crypto`、`node:buffer` 等模块。
## 部署到真实边缘
Demo 在本地运行,但部署到 Cloudflare 边缘很直接。最快的验证方式是用 [quick tunnel](https://developers.cloudflare.com/cloudflare-one/connections/connect-networks/get-started/create-local-tunnel/) 暴露本地 GreptimeDB(`cloudflared tunnel --url http://localhost:4000`),然后 `npx wrangler deploy`。访问部署后的 Worker URL,检查 `cf_ray` 字段是否非空——这是请求走过边缘网络的信号。
生产环境要同时支持读和写,需要 GreptimeDB 能被 Cloudflare 网络访问到。常见做法是用 [Cloudflare 命名隧道](https://developers.cloudflare.com/cloudflare-one/connections/connect-networks/)暴露 HTTP 和 PG wire 端口,再创建 Hyperdrive 绑定。完整的分步指南见 demo 仓库的 [DEPLOY.md](https://github.com/GreptimeTeam/demo-scene/blob/main/cloudflare-workers/DEPLOY.md)。
## 生产环境注意事项
**批量写入。** 每请求一次写入在中等流量下没问题。更高吞吐量时,把事件写进 [Cloudflare Queues](https://developers.cloudflare.com/queues/),由消费者 Worker 批量 POST 到 GreptimeDB。这遵循了 [Workers 最佳实践](https://developers.cloudflare.com/workers/best-practices/workers-best-practices/)中用 Queues 做非阻塞后台工作的建议。
**采样。** 流量大时没必要记录每个 200 OK。保留所有错误(4xx、5xx),对 2xx 做采样(比如 10%),延迟分布仍然有统计意义。
**TTL 和分区。** Demo 设了 `ttl = '30d'`。高流量场景再加[数据分区](https://docs.greptime.cn/user-guide/deployments-administration/manage-data/table-sharding)提升性能。
**为什么不用 `@greptime/ingester`?** 官方 TypeScript ingester 依赖 `@grpc/grpc-js`,底层的 `net` 和 `http2` 模块在 Workers V8 运行时中不可用(即使开了 `nodejs_compat`)。基于 fetch 的 ingester 在 SDK 路线图上。
## 总结
GreptimeDB 给 Cloudflare Workers 提供了一个实用的事件和指标存储方案——填补了"直接用 D1"和"搭建完整可观测性管线"之间的空白。写入走 InfluxDB 行协议 over HTTP,读取走 Hyperdrive + `postgres.js`,表结构注意低基数主键 + `append_mode` + TTL。[Demo 仓库](https://github.com/GreptimeTeam/demo-scene/tree/main/cloudflare-workers)里有完整代码,`docker compose up -d` 就能跑起来。
## 参考链接
- [Demo 仓库: cloudflare-workers](https://github.com/GreptimeTeam/demo-scene/tree/main/cloudflare-workers)
- [GreptimeDB InfluxDB 行协议文档](https://docs.greptime.cn/user-guide/protocols/influxdb-line-protocol)
- [Cloudflare Workers 文档](https://developers.cloudflare.com/workers/)
- [Cloudflare Hyperdrive](https://developers.cloudflare.com/hyperdrive/)
- [Hyperdrive postgres.js 集成](https://developers.cloudflare.com/hyperdrive/examples/connect-to-postgres/postgres-drivers-and-libraries/postgres-js/)
- [postgres.js](https://github.com/porsager/postgres)
- [GreptimeDB 数据分片和分区](https://docs.greptime.cn/user-guide/deployments-administration/manage-data/table-sharding)