Introduction
Prometheus is the de facto standard for cloud-native metrics, but the embedded TSDB was built for short retention. Teams that need months or years of history typically bolt on Thanos or Mimir, turning a single binary into a five-to-eight component distributed system. GreptimeDB is a Prometheus-compatible backend that speaks the same Remote Write protocol, runs PromQL on the HTTP API, and uses object storage as the primary tier, so existing scrapers, alerts, and Grafana dashboards keep working unchanged.
This guide is the migration counterpart of the Prometheus + Thanos/Mimir alternative article: the alternative article covers why; this one covers how. It walks through the four collector configurations GreptimeDB accepts via remote_write, the data-model mapping, a phased cutover that avoids dual-querying pain, and the production tuning knobs that matter at scale.
Migration Scenarios
The remote_write protocol is the universal pivot. Four common source stacks all migrate the same way:
- Vanilla Prometheus scraping locally and writing to GreptimeDB for long-term storage. Local TSDB stays for short-window queries and alerting; GreptimeDB holds anything older.
- Thanos: the Sidecar / Compactor / Store Gateway / Querier stack is replaced by GreptimeDB. Existing Prometheus instances keep scraping; the Thanos Sidecar is removed, and remote_write points at GreptimeDB instead.
- Mimir: same shape. Mimir's Distributor / Ingester / Querier / Compactor is replaced; collectors that already remote_write to Mimir simply repoint to GreptimeDB.
- VictoriaMetrics with vmagent:
vmagentuses a slight Prometheus remote_write variant for better compression. GreptimeDB accepts that variant directly; only the URL changes.
Existing Grafana dashboards do not need to be rewritten in any of these scenarios. Alert and recording rules continue to evaluate in the local Prometheus instance that keeps scraping; GreptimeDB serves as the long-term query backend, not a rule engine replacement.
How Remote Write Maps to GreptimeDB's Data Model
A Prometheus sample is {__name__, labels, value, timestamp}. GreptimeDB maps it as follows per the ingestion docs:
| Prometheus | GreptimeDB | Type |
|---|---|---|
| Metric name | Table (auto-created) | String |
| Label | Column (Tag) | String |
| Value | Column (Field) | Double |
| Timestamp | Column (Time Index) | Timestamp |
Each metric becomes its own logical table. Behind the scenes, the metric engine collapses thousands of logical tables into a single physical table (the default is greptime_physical_table), so columnar compression and queries stay efficient. This is enabled by default and requires no configuration. A SHOW TABLES lists the logical metrics; DESC TABLE greptime_physical_table shows the unified storage schema.
Because the mapping is automatic, existing PromQL queries hit the logical tables and behave identically. SQL becomes available as a second query language on the same data, useful for the analytical queries PromQL was never meant to handle.
Remote Write Configuration by Collector
Four equivalent ways to point ingestion at GreptimeDB. The URL pattern is the same in every case: http://<host>:4000/v1/prometheus/write?db=<dbname>.
Prometheus prometheus.yml:
remote_write:
  - url: http://greptimedb:4000/v1/prometheus/write?db=public
    basic_auth:
      username: greptime_user
      password: greptime_pwd

remote_read:
  - url: http://greptimedb:4000/v1/prometheus/read?db=public
    basic_auth:
      username: greptime_user
      password: greptime_pwd
Grafana Alloy (config.alloy): uses Alloy's prometheus.remote_write component; same URL, same auth shape. See the Alloy remote_write reference.
Vector (vector.toml):
[sources.my_source_id]
type = "internal_metrics"

[sinks.prometheus_remote_write]
type = "prometheus_remote_write"
inputs = ["my_source_id"]
endpoint = "http://greptimedb:4000/v1/prometheus/write?db=public"
compression = "snappy"
auth = { strategy = "basic", username = "<username>", password = "<password>" }
VictoriaMetrics vmagent: point -remoteWrite.url at GreptimeDB and the compressed variant is auto-detected:
vmagent -remoteWrite.url=http://greptimedb:4000/v1/prometheus/write?db=publicIf authentication is enabled, add basic_auth (Prometheus, Alloy), an auth block as shown in the Vector example above, or -remoteWrite.basicAuth.* flags (vmagent).
Phased Cutover: Dual-Write, Switch, Drain
A safe migration takes five phases. None require modifying scraped targets or Grafana dashboards.
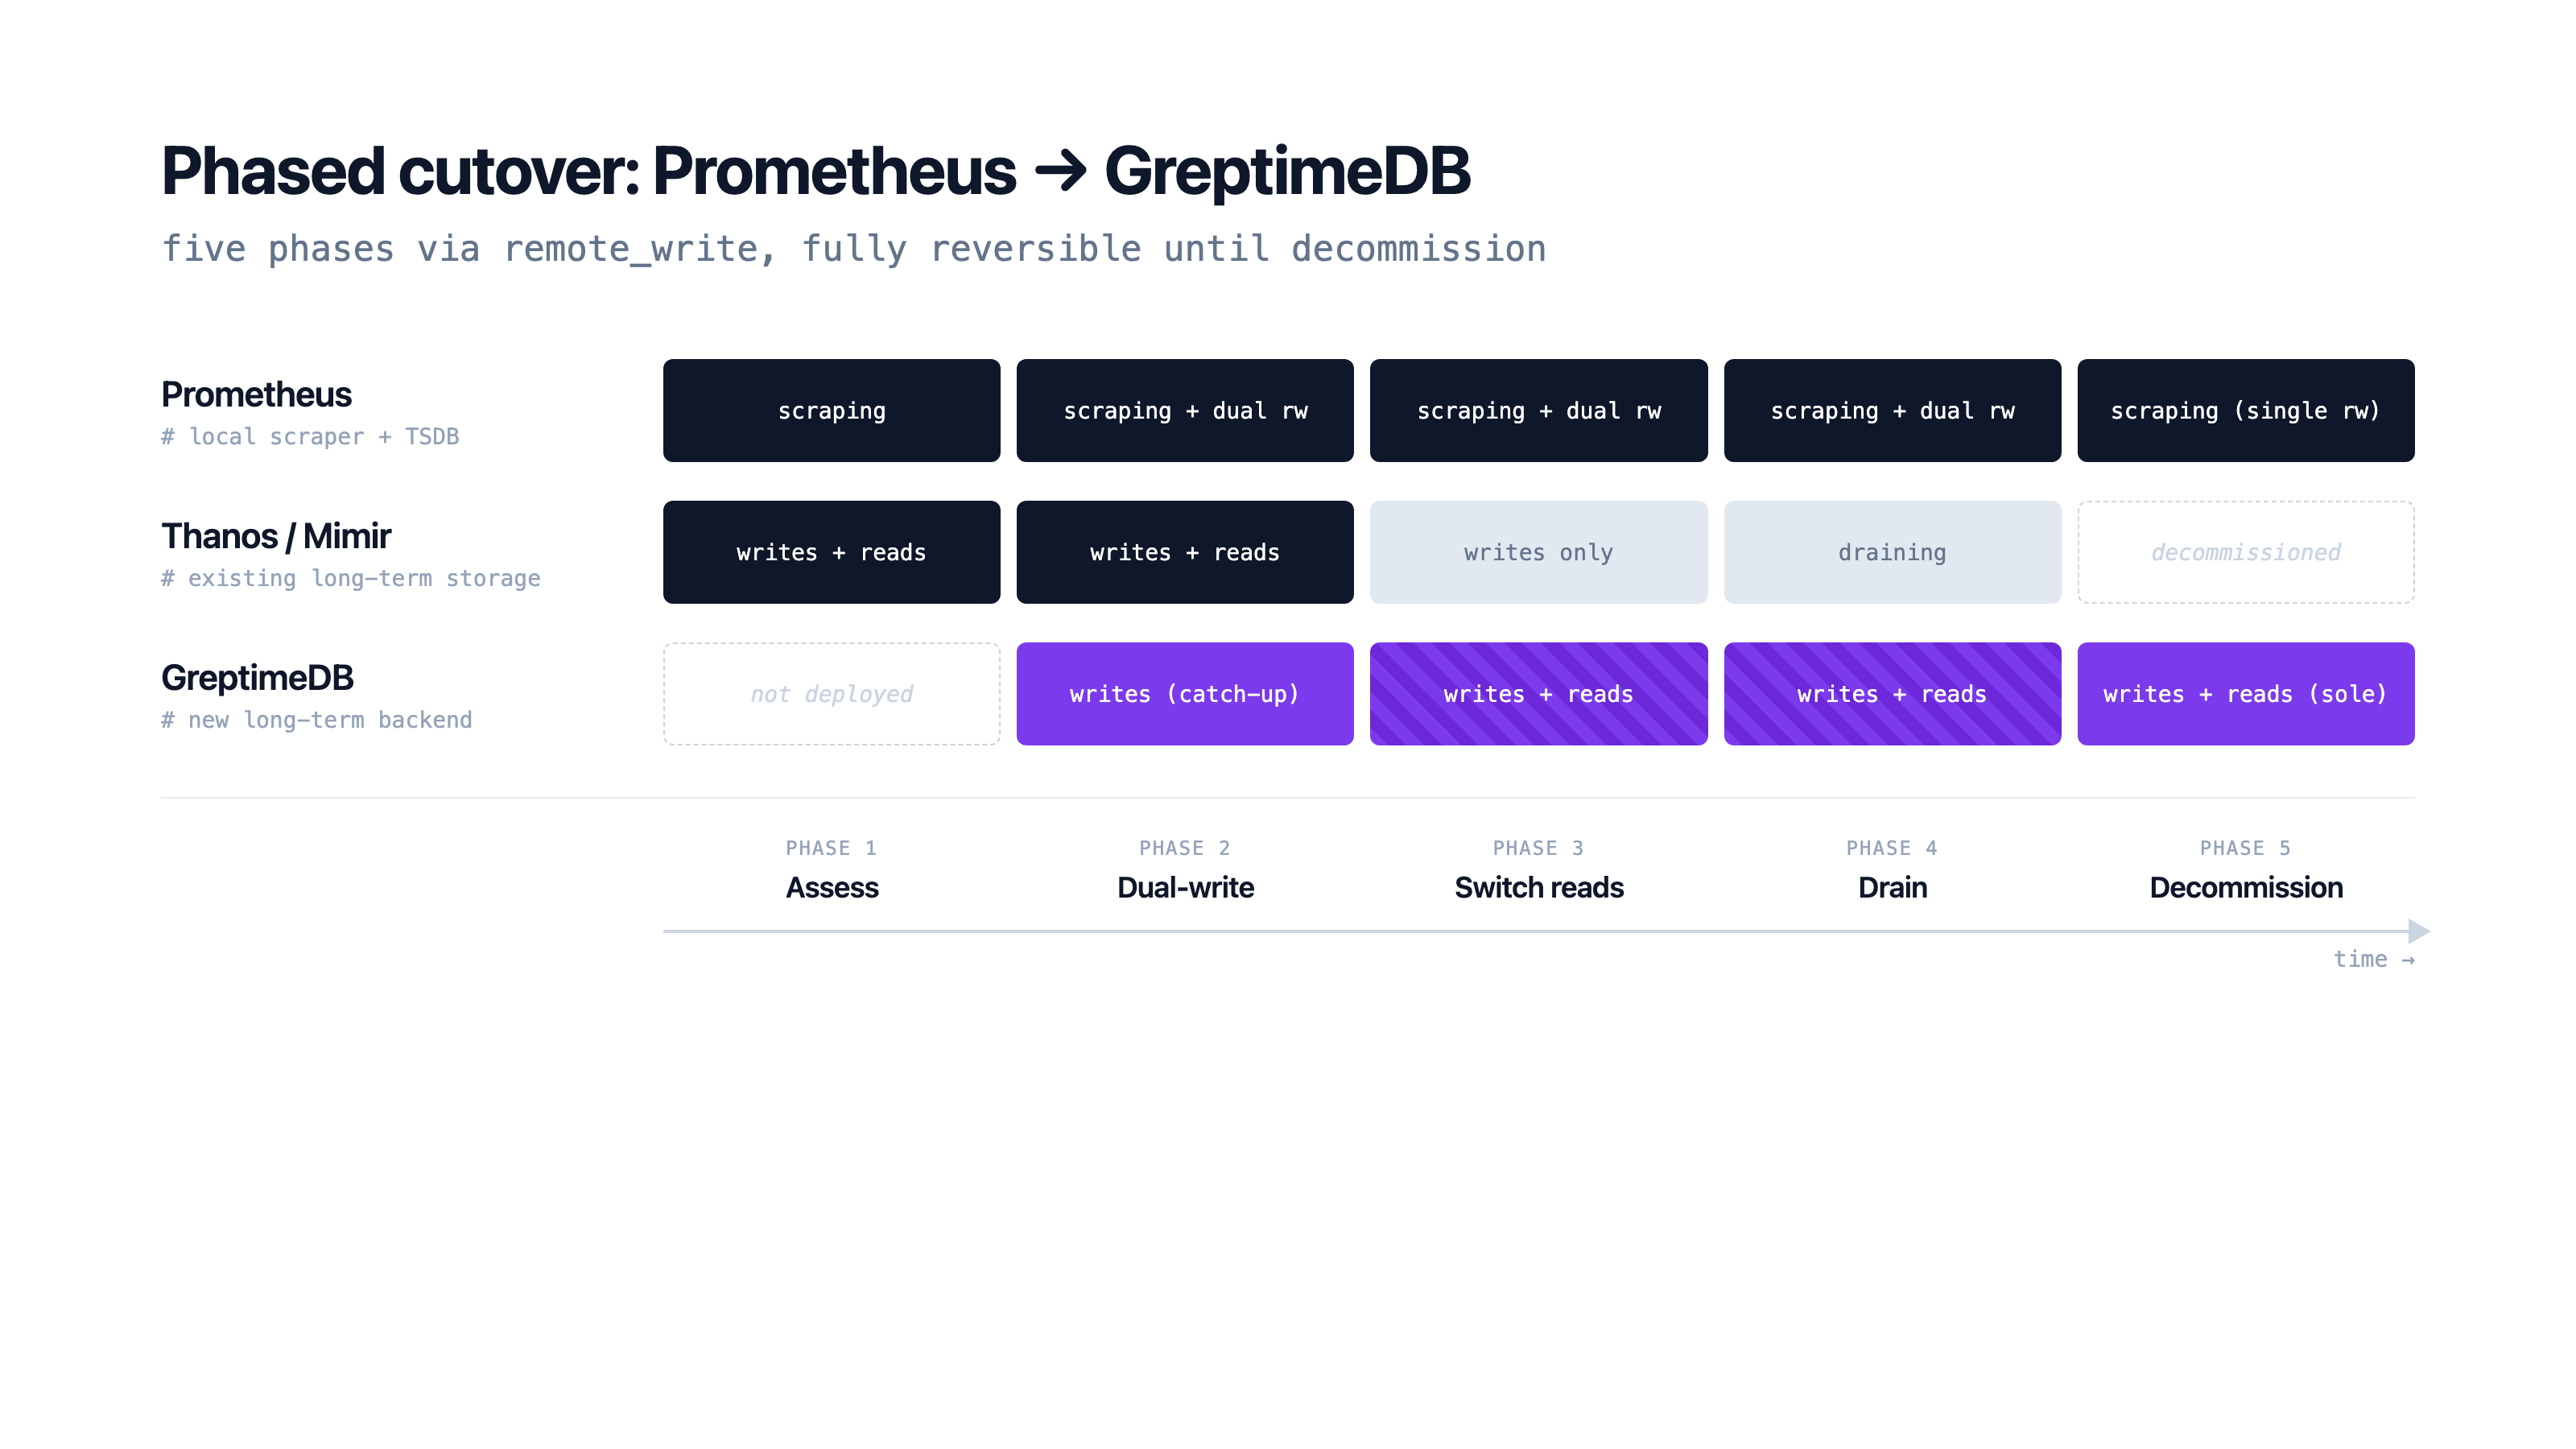
- Assess: capture current cardinality, retention, and the queries that hit long-term storage today. The cardinality estimate decides whether the default single-partition physical table is enough or whether custom partition columns are needed (see the next section).
- Dual-write: add a second
remote_writeentry pointing at GreptimeDB. Prometheus fans out to both backends. Thanos Sidecar or Mimir keeps running unchanged. New data starts populating GreptimeDB while the old stack stays the source of truth. - Switch reads: once GreptimeDB has enough history to satisfy the queries that matter, repoint Grafana's Prometheus data source URL at GreptimeDB's PromQL HTTP API. Alert rules using
prometheus.rulescontinue evaluating against local Prometheus; long-window queries now resolve from GreptimeDB. - Drain: keep the old stack writing until its configured retention window has elapsed, or until the historical-query window your team needs from the new backend has been satisfied (whichever comes later).
- Decommission: remove the Thanos Sidecar, Compactor, Store Gateway, Querier (or Mimir's component set) and the remote_write entry that pointed at them. Only the local Prometheus and GreptimeDB remain.
Dual-write makes the cutover reversible at any point. If a query regression surfaces during the switch phase, the read path returns to the old stack without data loss.
Querying via the PromQL HTTP API
GreptimeDB exposes the standard Prometheus HTTP API at /v1/prometheus/api/v1/*. Grafana's Prometheus data source needs only the URL changed:
http://greptimedb:4000/v1/prometheusInstant queries, range queries, and label endpoints work as expected, and the RFC3339 timestamp format used by query_range is supported. GreptimeDB tracks over 90% PromQL compliance, so common dashboards and queries run unchanged, but a few semantics differ from upstream Prometheus: the @ modifier is not supported, computations run at millisecond precision (higher-precision timestamps are implicitly converted), and a small set of multiple-input functions and grouping forms remain unsupported. Validate alert and recording rules running against GreptimeDB, plus any edge-case queries, before treating it as a drop-in for long-term reads.
When PromQL is the wrong tool (top-N queries with arbitrary group-by, joins against logs or traces, ad hoc analytics on extracted columns), the same data is reachable via GreptimeDB SQL over HTTP, MySQL, or PostgreSQL protocols. Metrics, logs, and traces share one engine, so the metrics-only ceiling that drove the original Thanos/Mimir bolt-on doesn't get rebuilt elsewhere.
Production Tuning: Partitions, Batching, Indexes
Three settings matter once volume grows past a single datanode.
Partition the physical table by a high-cardinality label that you also use for queries. The default single partition means one datanode absorbs all writes; partitioning lets the cluster spread ingestion. For a Kubernetes monitoring workload, namespace is the usual choice:
CREATE TABLE greptime_physical_table (
    greptime_timestamp TIMESTAMP(3) NOT NULL,
    greptime_value DOUBLE NULL,
    namespace STRING PRIMARY KEY,
    TIME INDEX (greptime_timestamp),
)
PARTITION ON COLUMNS (namespace) (
  namespace < 'g',
  namespace >= 'g' AND namespace < 'n',
  namespace >= 'n' AND namespace < 't',
  namespace >= 't'
)
ENGINE = metric
WITH ("physical_metric_table" = "");
Aim for 2-3× the initial datanode count in partitions so future scale-out is just partition migration.
Enable batching mode in [prom_store] for clustered deployments. With pending_rows_flush_interval = "500ms", GreptimeDB accumulates incoming rows and flushes in larger batches. The docs cite up to 2× throughput in clusters with multiple regions. Batching is off by default; turn it on when ingestion is the bottleneck.
Add skipping indexes if specific labels drive most queries. Set index.type = "skipping" when creating the physical table; auto-added columns inherit the index, and queries skip irrelevant data blocks.
A Real Migration: DeepXplore from Thanos
DeepXplore, an AI startup running models trained on long-window Prometheus data, migrated off Thanos for the same reason most teams do: the operational overhead of running the Thanos component set in Kubernetes was consuming engineering time that should have gone to product. In their own words, Thanos's "installation and maintenance" was complex enough that they wanted to shift focus from managing infrastructure to building features.
After migrating, the long-term storage layer collapsed from the Thanos component set (Sidecar, Compactor, Store Gateway, Querier on top of object storage) to GreptimeDB and its dependencies (etcd for metadata, Kafka optional). Long-term query latency improved as a side effect; the primary win was operational.
Verification and Common Pitfalls
A few checks during dual-write confirm the migration is healthy. Run count_over_time(up[5m]) against both backends over a recent five-minute window. A persistent gap signals dropped writes, usually a remote_write queue or batch-size limit on the collector side. Confirm histogram bucket boundaries match in test dashboards before cutting reads over, since native and classic histograms map differently. Watch the cardinality budget: a label that was bounded under one tenant's Thanos can explode when many tenants ingest into a shared GreptimeDB physical table, so partition by tenant or by a high-cardinality label as shown above.
The reversible cutover pattern, keeping the old stack writing until the new stack is verified and then draining, is the single safest practice. Dual-querying for weeks is normal; rushing the decommission is not.
Conclusion
A Prometheus → GreptimeDB migration is a remote_write URL change plus phased cutover, not a rewrite. PromQL keeps working, Grafana keeps working, and the Thanos / Mimir component stack goes away. For teams whose retention has outgrown the embedded TSDB but whose engineering time should not be going to component plumbing, that is the point of the migration.
If the next question is whether to run the OSS or the enterprise tier, see the Prometheus long-term storage alternative article for the architectural comparison, and the compare/prometheus page for the feature-by-feature breakdown.
About Greptime
GreptimeDB is an open-source, cloud-native database purpose-built for real-time observability. Built in Rust and optimized for cloud-native environments, it provides unified storage and processing for metrics, logs, and traces, delivering sub-second insights from edge to cloud at any scale.
- GreptimeDB OSS: the open-source database for observability and IoT workloads, with compute-storage disaggregation and object storage as the primary tier.
- GreptimeDB Enterprise: adds operational features for production scale, including 5× bulk ingestion, auto-repartition, read replicas, LDAP/RBAC, management console, and 24/7 expert support.
Stay in the loop
加入我们的社区
获取 Greptime 最新更新,并与其他用户讨论。

