本页内容
With the rapid advancement of artificial intelligence technology, OpenAI has emerged as one of the leaders in the field. It excels in various language processing tasks, including machine translation, text classification, and text generation.
However, the critical role of continuous monitoring of API calls while using OpenAI should not be underestimated. This practice is crucial not only for identifying performance bottlenecks and analyzing usage patterns but also for swiftly detecting and addressing any issues that arise with the API.
GreptimeAI
GreptimeAI offers a tailor-made observability solution specifically designed for monitoring and managing large language model (LLM) applications. This solution provides comprehensive insights into the cost, performance, traffic, and security aspects of OpenAI usage. For more details about GreptimeAI, please refer to this article. Notably, GreptimeAI is built upon the open-source time-series database, GreptimeDB.
OpenAI Modules being Monitored
- chat
- completion
- audio
- images
Scenarios Supported
- async
- stream
- with_raw_response
- retry
- error
User Guide
Installation
python
pip install --upgrade greptimeaiRegistration
To get started, create a service by registering greptimeai, and get:
- host
- database
- token
Setting up
Shell
export GREPTIMEAI_HOST='xxx'
export GREPTIMEAI_DATABASE='xxx'
export GREPTIMEAI_TOKEN='xxx'
Example
Here is a simple example to illustrate how to call OpenAI chat completion with GreptimeAI tracking enabled.
python
from greptimeai import openai_patcher
from openai import OpenAI

client = OpenAI()
openai_patcher.setup(client=client)

completion = client.chat.completions.create(
    messages=[
        {
            "role": "user",
            "content": "How do I output all files in a directory using Python?",
        }
    ],
    model="gpt-4",
    user="<user_id_from_your_application>",
    stream=True,
)
How does it look like in GreptimeAI
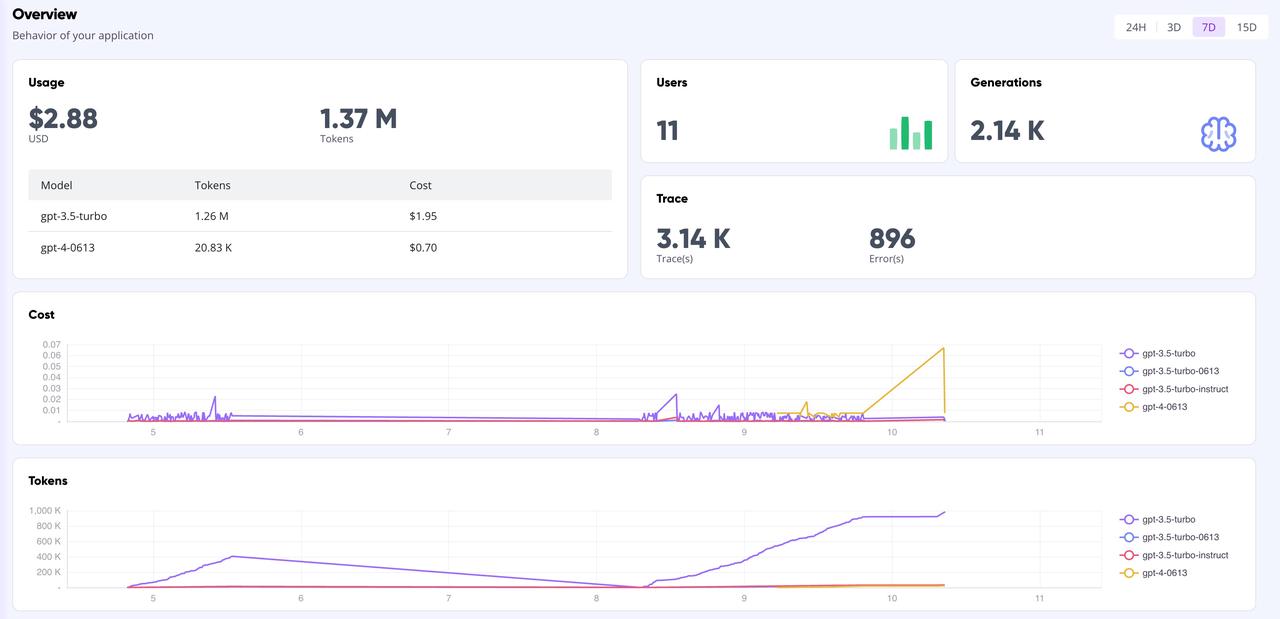
Dashboard overview:
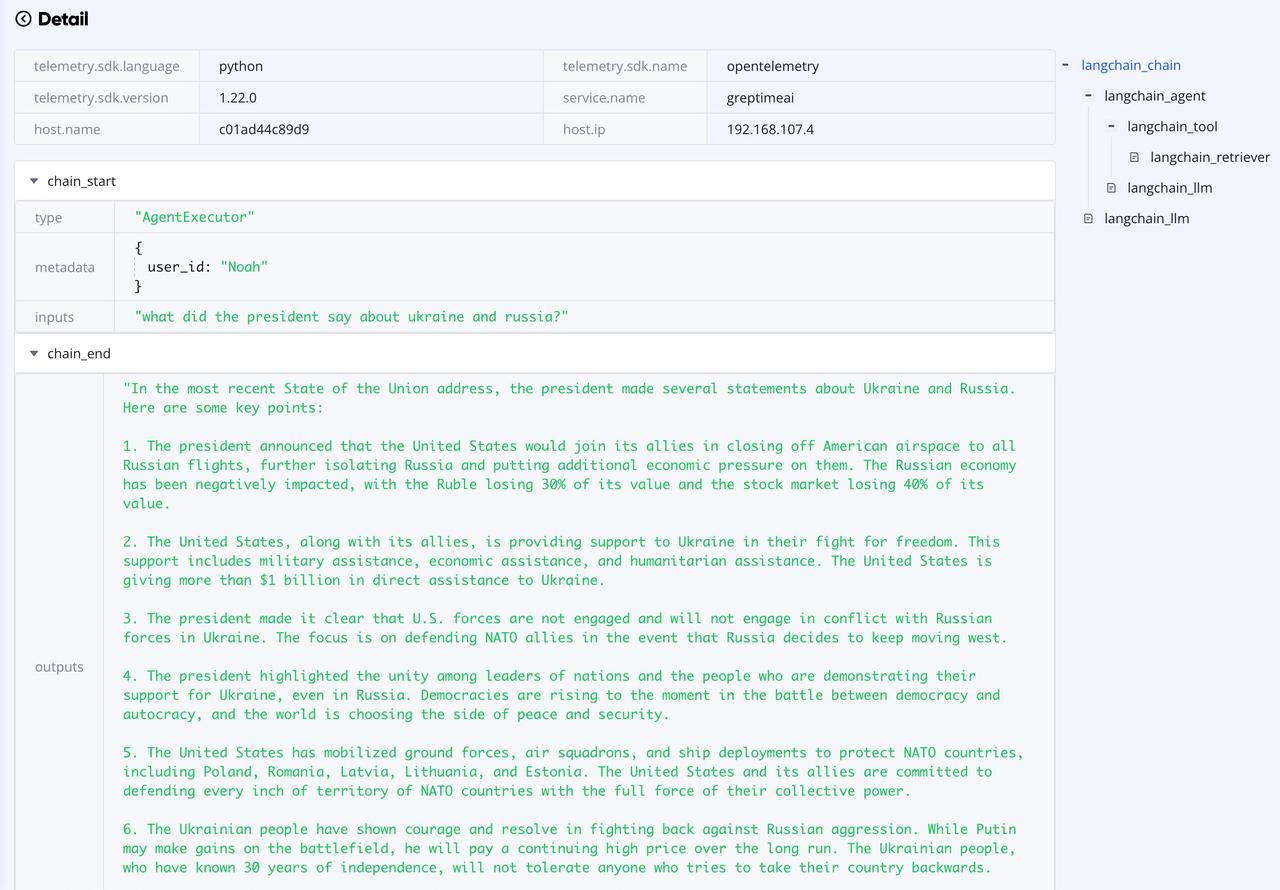
The following graph shows the trace detail with multiple spans.