Introduction
VictoriaMetrics is fast and cost-efficient at what it does. For pure metrics workloads, it earns its reputation. The trade-off arrives once observability extends beyond metrics: logs need VictoriaLogs, traces need VictoriaTraces, and the team ends up running three systems with three query languages — PromQL/MetricsQL, LogsQL, and a separate trace backend.
GreptimeDB takes the opposite approach: metrics, logs, traces, and wide events live in one engine on a stateless compute tier with native object storage. SQL and PromQL are first-class query interfaces against the same tables, so cross-signal correlation happens inside the database instead of in an external pipeline.
This article walks through where GreptimeDB is a direct VictoriaMetrics alternative for unified observability, the architectural trade-offs, and a real-world migration story from a team that made the switch.
The Victoria Stack: Three Systems, Three Query Languages
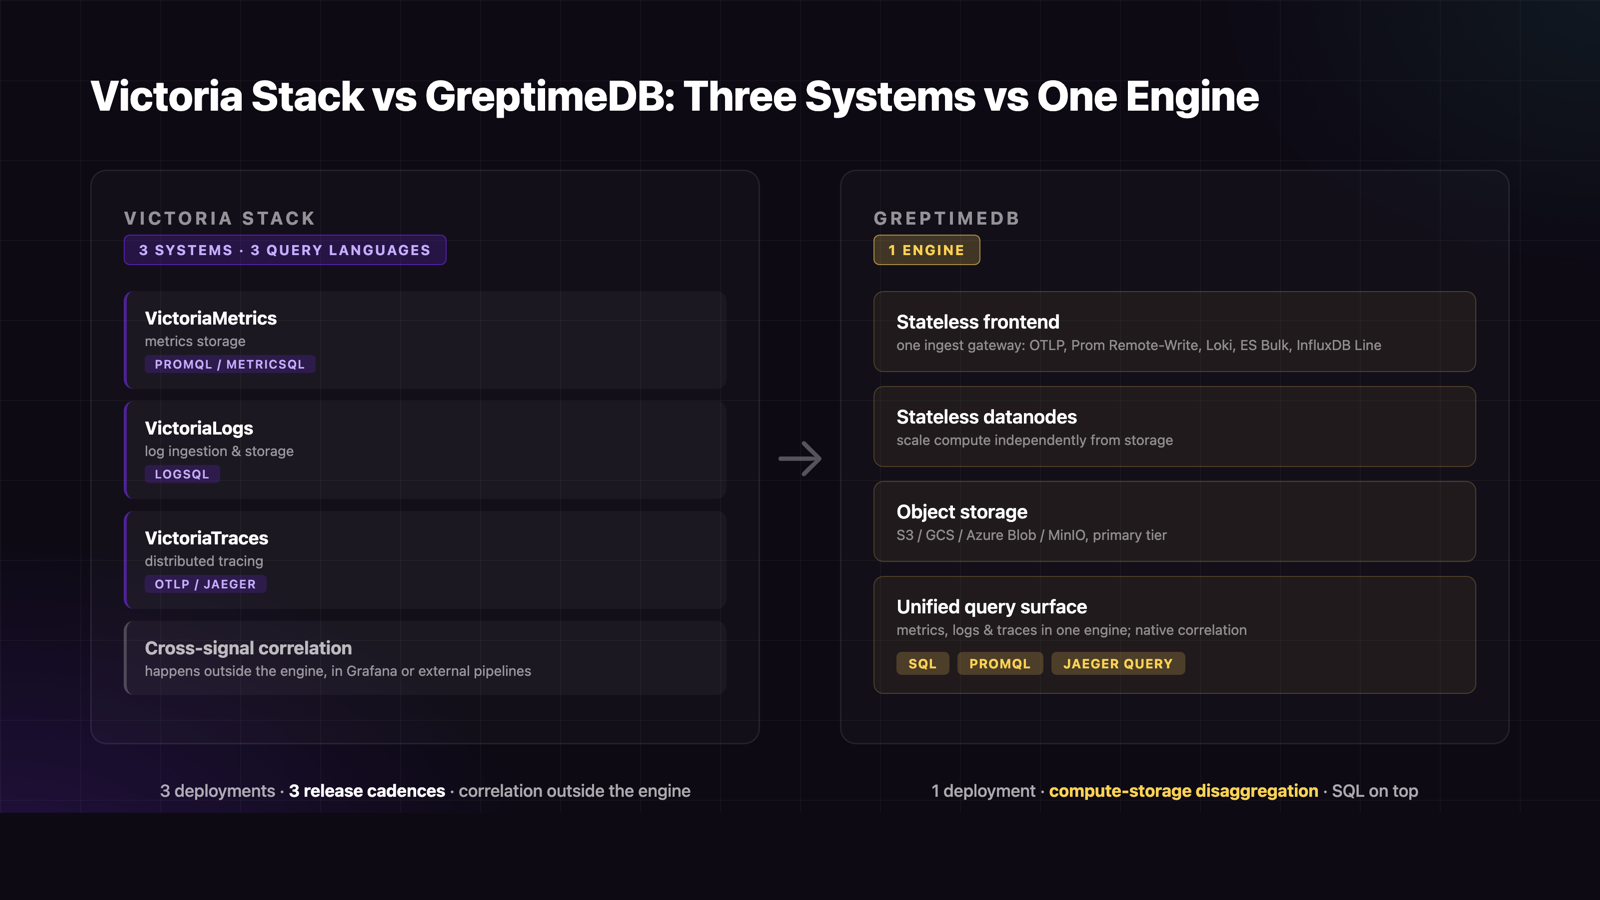
The Victoria Stack covers all three observability signals, but as separate products:
- VictoriaMetrics: metrics storage, PromQL/MetricsQL query.
- VictoriaLogs: log ingestion and storage, LogsQL pipe-style query.
- VictoriaTraces: distributed tracing via OTLP/Jaeger.
Each is excellent at its scope, and the underlying storage approach (LSM-tree variants, time-partitioned blocks, zstd compression) is sound. The cost shows up at the operational layer: separate ingest endpoints, separate retention policies, separate query languages, separate scaling decisions, and separate failure modes. Cross-signal correlation — correlating a latency spike in metrics with the matching trace and the relevant pod logs — has to happen outside the engine, typically through Grafana plus external joining logic.
One Engine vs Three Stacks
GreptimeDB consolidates ingestion, storage, and query for all three signals into one cloud-native engine:
- Stateless frontend for ingestion and query routing.
- Stateless datanodes holding region replicas, scaled independently.
- Object storage (S3, GCS, Azure Blob, MinIO) as the primary storage layer, not a cold tier.
- SQL + PromQL as first-class query interfaces, plus PostgreSQL and MySQL wire-protocol compatibility for existing tooling.
Practically: a Grafana dashboard that drives PromQL against VictoriaMetrics points at GreptimeDB without rewriting expressions. Existing log pipelines write through the Loki Push API, Elasticsearch Bulk API, or OpenTelemetry OTLP. Traces flow through the same OTLP endpoint and are queryable through the native Jaeger Query API.
The operational footprint collapses from "three deployments, three release cadences, three sets of dashboards-about-dashboards" to one engine that stores and queries everything.
Case: D6's Migration from VictoriaMetrics
D6 Monitoramento, a Brazilian industrial IoT team, ran VictoriaMetrics in production before switching. Their workload covers 20 industrial assets, 10 edge gateways, and 30 sensors, with over 1.2 billion data points stored on a single standalone GreptimeDB node — targeting 10 years of retention.
VictoriaMetrics handled the metrics ingestion side fine. The break point came when they needed to do more than monitor: exporting historical data and restructuring it for analysis was not straightforward in the metrics-only model. PromQL is the right tool for dashboards but a poor fit for the kind of ad-hoc analytical SQL their team needed for higher-level insights. They evaluated TimescaleDB but it required significantly more infrastructure for the same workload.
What they got from GreptimeDB:
- PromQL still drives real-time dashboards, unchanged from the VM-shaped workflow.
- SQL handles the analytical side, querying historical data across multiple dimensions for restructuring and trend analysis.
- The Flow engine runs incremental, streaming aggregations to derive higher-level indicators from raw electrical measurements — inferring whether a machine is running or idle, its operational cycles, and in some cases the type of product being manufactured.
The combination of SQL + PromQL + Flow in one system addressed gaps that would have required an additional analytical store on top of VictoriaMetrics.
Storage and Compression
Both Victoria Stack and GreptimeDB use columnar-style compression with zstd, and both partition by time. The architectural divergence is where data sits at rest.
VictoriaLogs and VictoriaMetrics use local block storage as primary, with optional remote backup. GreptimeDB writes immutable Apache Parquet files directly to object storage, with a multi-tier cache for hot reads. At current AWS list prices, S3 Standard at ~$0.023/GB/mo sits roughly 3–5× below provisioned SSD EBS (gp3 ~$0.08/GB/mo), and benchmarks show only 1–2% throughput loss on AWS S3 versus local disk.
For high-cardinality workloads — millions of unique series from request IDs or device IDs — GreptimeDB v1.0 ships flat format as the default SST layout, delivering 4× write throughput and up to 10× faster queries on millions of series without the memory pressure that breaks series-oriented stores.
A direct head-to-head benchmark between GreptimeDB and VictoriaMetrics has not been published; the case here rests on architectural unification and the D6 migration story rather than a metrics-vs-metrics throughput claim.
Migration Path
The Victoria Stack comparison documents a one-week incremental cutover:
- Redirect metrics remote-write (~30 minutes). Switch your Prometheus remote-write target to GreptimeDB. PromQL dashboards keep working unchanged.
- Redirect log ingestion (~1 hour). Route VictoriaLogs ingestion to GreptimeDB through the Loki Push API or compatible HTTP endpoint.
- Backfill history (1–3 days). Bulk import historical data while live ingestion continues in parallel.
- Decommission the Victoria stack (~2 weeks). After parity validation, shut down VictoriaMetrics, VictoriaLogs, and VictoriaTraces one by one.
Existing collectors — Prometheus agents, Vector, OpenTelemetry, Telegraf — write through unchanged because GreptimeDB accepts their native protocols.
When VictoriaMetrics Still Wins
This is an alternative-for-unified-observability comparison, not a "VictoriaMetrics is bad" argument. VictoriaMetrics remains the better choice for:
- Metrics-only deployments. If logs and traces live in entirely separate systems and there is no plan to consolidate, the single-component VM footprint is hard to beat.
- Existing Victoria-shaped teams. Deep MetricsQL expertise, custom downsampling configurations, or workloads tuned around VM's specific behaviour favour staying.
- Metrics-only cost optimisation. VM's storage efficiency on pure metrics is excellent; if that is the only workload, the migration ROI is harder to make.
The case for GreptimeDB as a VictoriaMetrics alternative gets strongest when the team is operating two or three Victoria components, when cross-signal correlation matters, or when an analytical SQL surface on top of time-series data is on the roadmap.
Conclusion
GreptimeDB is a direct alternative to the Victoria Stack for teams that need metrics, logs, and traces under one engine: SQL plus PromQL on a stateless compute tier with native object storage, instead of three components with three query languages. PromQL dashboards keep working unchanged, and the analytical surface that VictoriaMetrics deliberately leaves out is built in.
See the full GreptimeDB vs. Victoria Stack comparison for the feature-by-feature breakdown, or deploy GreptimeDB on Kubernetes to test it against your current Victoria deployment.
About Greptime
GreptimeDB is an open-source, cloud-native database purpose-built for real-time observability. Built in Rust and optimized for cloud-native environments, it provides unified storage and processing for metrics, logs, and traces — delivering sub-second insights from edge to cloud at any scale.
GreptimeDB OSS – The open-sourced database for small to medium-scale observability and IoT use cases, ideal for personal projects or dev/test environments.
GreptimeDB Enterprise – A robust observability database with enhanced security, high availability, and enterprise-grade support.
We're open to contributors — get started with issues labeled good first issue and connect with our community.
Stay in the loop
加入我们的社区
获取 Greptime 最新更新,并与其他用户讨论。

