

本页内容

背景
Prometheus 发展至今,已成为云原生时代 Metrics 监控的事实标准如下:
- HTTP Endpoint + Pull Scrape 成为暴露和收集 Metrics 的主流方式(这一模式最早源自 Google 的 Borg);
- 结合 Prometheus 数据模型(Gauge / Counter / Histogram / Summary),PromQL 逐渐成为 Metrics 数据查询的主流语言。
然而,Prometheus 未被视为一个高性能、可扩展的数据库。在大规模场景下,开发者需要在原生 Prometheus 之上进行很复杂的优化才能承载海量的监控数据。
从技术演进的角度来看,Prometheus 的精髓在于为 Metrics 领域提供了一套简洁有效且实用的数据模型,并由此形成了丰富的技术生态。
作为一款泛时序数据库,GreptimeDB 不仅充分继承了 Prometheus 先驱们打造的技术生态,还在云原生场景中设计了更高性能的特性。简而言之,我们具备:
- 充分兼容 Prometheus 生态
- 对 PromQL 的兼容度高达 90% 以上,为第三方实现中对 PromQL 兼容度最高的时序数据库;
- 支持 Prometheus Remote Write 和 Remote Read,并支持标准的 Prometheus HTTP 数据查询接口;
- 支持 SQL 协议:除了支持 PromQL,GreptimeDB 还支持 SQL,能够让更多用户无需额外学习成本就能编写更具表达力的查询。更有趣的是,我们可以在 SQL 查询中使用 PromQL,使这两种数据查询语言相得益彰;
- 基于廉价对象存储的存算分离架构:在保证性能的前提下,存算弹性伸缩,极具性价比。用户可以使用单点模式来承载小规模业务,也可以使用集群模式来支持海量数据;
综上所述,使用 GreptimeDB 就等于选择了一个更高性能且更具可扩展性的 Prometheus。
本文将以 Node Exporter 作为业务场景,逐步向用户介绍如何在 Kubernetes 环境中使用 GreptimeDB 取代原有的 Prometheus 的场景,从而为 Prometheus 装配一个高性能的云原生时序数据引擎。
准备测试环境
创建 Kubernetes 测试环境
如果你已经有了可供测试的 Kubernetes 环境,那么此步骤可以忽略。
我们推荐使用优秀的 Kind 工具(具体的安装请用户参考具体文档)在本地创建一个拥有 5 个节点的 Kubernetes 集群,使用的命令如下所示:
bash
cat <<EOF | kind create cluster --config=-
kind: Cluster
apiVersion: kind.x-k8s.io/v1alpha4
nodes:
- role: control-plane
- role: worker
- role: worker
- role: worker
- role: worker
EOF
创建成功后,使用 kubectl 可以看到你拥有了一个 5 节点的 K8s,如下:
bash
$ kubectl get nodes
NAME                 STATUS   ROLES           AGE   VERSION
kind-control-plane   Ready    control-plane   42s   v1.27.3
kind-worker          Ready    <none>          19s   v1.27.3
kind-worker2         Ready    <none>          19s   v1.27.3
kind-worker3         Ready    <none>          20s   v1.27.3
kind-worker4         Ready    <none>          24s   v1.27.3
部署 Node Exporter
Node Exporter 是由 Prometheus 开源的用于监控节点状态的 Collector。我们可以使用 Helm 来将 Node Exporter 安装到 node-exporter 这个 namespace 中:
- 先添加相应的 Helm Repo:
bash
helm repo add prometheus-community https://prometheus-community.github.io/helm-charts
helm repo update- 安装 Node Exporter:
bash
helm install \
  node-exporter prometheus-community/prometheus-node-exporter \
  --create-namespace \
  -n node-exporter
上述命令将在每个 Node 上安装 node-exporter 采集节点指标,采集到的指标将以 /metrics 的形式暴露在 :9100 端口。
安装完成之后,我们将观察到 Pod 状态:
bash
$ kubectl get pods -n node-exporter
NAME                                           READY   STATUS    RESTARTS   AGE
node-exporter-prometheus-node-exporter-4gt6x   1/1     Running   0          10s
node-exporter-prometheus-node-exporter-j8blr   1/1     Running   0          10s
node-exporter-prometheus-node-exporter-kjvzg   1/1     Running   0          10s
node-exporter-prometheus-node-exporter-q2fc9   1/1     Running   0          10s
node-exporter-prometheus-node-exporter-tm9lr   1/1     Running   0          10s
接下来,我们将以 Node Exporter 作为业务容器,利用 Prometheus 进行 Metrics 的采集和观测。
安装 Prometheus Operator
在 K8s 环境中使用 Prometheus,我们需要部署 prometheus-operator 。Prometheus Operator 基于 K8s Operator 模型定义一套 CRD,使得开发者可以很容易通过编写 YAML 文件来用 Prometheus 监控自己的业务。Prometheus Operator 这套 CRD 使用非常广泛,同样是 K8s 中运维 Prometheus 的事实标准。
我们可以使用以下命令直接通过 YAML 文件安装 Prometheus Operator:
bash
LATEST=$(curl -s https://api.github.com/repos/prometheus-operator/prometheus-operator/releases/latest | jq -cr .tag_name)
curl -sL https://github.com/prometheus-operator/prometheus-operator/releases/download/${LATEST}/bundle.yaml | kubectl create -f -以上操作将安装以下组件:
- prometheus-operator 所需的 CRDs,包括:
sql
alertmanagerconfigs.monitoring.coreos.com   2024-08-08T07:08:18Z
alertmanagers.monitoring.coreos.com         2024-08-08T07:08:35Z
podmonitors.monitoring.coreos.com           2024-08-08T07:08:18Z
probes.monitoring.coreos.com                2024-08-08T07:08:18Z
prometheusagents.monitoring.coreos.com      2024-08-08T07:08:36Z
prometheuses.monitoring.coreos.com          2024-08-08T07:08:36Z
prometheusrules.monitoring.coreos.com       2024-08-08T07:08:19Z
scrapeconfigs.monitoring.coreos.com         2024-08-08T07:08:19Z
servicemonitors.monitoring.coreos.com       2024-08-08T07:08:19Z
thanosrulers.monitoring.coreos.com          2024-08-08T07:08:37Z
实际使用的时候重点关注 PrometheusAgent 和 ServiceMonitor 即可。
- prometheus-operator 服务及其相关连的其他 K8s 资源(如 RBAC 等);
创建成功后你将观察到:
bash
$ kubectl get pods
NAME                                   READY   STATUS    RESTARTS       AGE
prometheus-operator-5b5cdb686d-rdddm   1/1     Running   0              10s
创建 GreptimeDB Cluster
安装 GreptimeDB Operator
为了更好地让 GreptimeDB 运行在 Kubernetes 上,我们开发并开源了 GreptimeDB Operator[5],并抽象出 GreptimeDBCluster 和 GreptimeDBStandalone 两种 CRD,来分别管理 Cluster 和 Standalone 模式下的 GreptimeDB。
同样可以使用 Helm 命令安装 GreptimDB Operator:
- 添加对应的 Helm Repo:
bash
helm repo add greptime https://greptimeteam.github.io/helm-charts/
helm repo update- 将 GreptimeDB Operator 安装到
greptimedb-adminnamespace 下:
bash
helm install \
  greptimedb-operator greptime/greptimedb-operator \
  --create-namespace \
  -n greptimedb-admin
安装成功后,你将观察到 GreptimeDB Operator 已成功运行起来:
bash
$ kubectl get po -n greptimedb-admin
NAME                                   READY   STATUS    RESTARTS   AGE
greptimedb-operator-75c48676f5-4fjf8   1/1     Running   0          10s
构建 GreptimeDB Cluster
GreptimeDB Cluster 的集群模式依赖于 etcd 作为元数据服务,可以用以下命令快速创建一个 3 节点的 etcd-cluster:
bash
helm upgrade \
  --install etcd oci://registry-1.docker.io/bitnamicharts/etcd \
  --set replicaCount=3 \
  --set auth.rbac.create=false \
  --set auth.rbac.token.enabled=false \
  --create-namespace \
  -n etcd-cluster
创建成功后,可以通过以下命令检查 etcd-cluster 状态:
bash
$ kubectl get po -n etcd-cluster
NAME     READY   STATUS    RESTARTS        AGE
etcd-0   1/1     Running          0        20s
etcd-1   1/1     Running          0        20s
etcd-2   1/1     Running          0        20s
接下来,我们可以直接创建一个最小的 GreptimeDB 集群,并观察其弹性伸缩过程:
bash
cat <<EOF | kubectl apply -f -
apiVersion: greptime.io/v1alpha1
kind: GreptimeDBCluster
metadata:
  name: mycluster
spec:
  base:
    main:
      image: greptime/greptimedb:latest
  frontend:
    replicas: 1
  meta:
    replicas: 1
    etcdEndpoints:
      - "etcd.etcd-cluster:2379"
  datanode:
    replicas: 1
EOF
部署成功后,我们将看到这个 GreptimeDB 集群有 3 个 Pod:
bash
$ kubectl get greptimedbclusters.greptime.io
NAME        FRONTEND   DATANODE   META   FLOWNODE   PHASE     VERSION    AGE
mycluster 1 1 1 0 Running latest 1m- Frontend:用于处理用户的读写请求;
- Datanode:用户处理来自 Frontend 的请求的存储和计算单元;
- Metasrv:集群的元数据服务;
此时:mycluster-frontend.default.cluster.svc.local 这个 K8s 内部的域名将作为我们向外暴露 Cluster 能力的入口。当使用 Remote Write 协议将 Metrics 数据写入集群时,我们需要使用如下 URL:
bash
http://mycluster-frontend.default.cluster.svc.local:4000/v1/prometheus/write?db=public我们默认使用 public 数据库。
开启我们的监控
创建 Prometheus Agent
由于 Prometheus Metrics 监控采用的被动的 Pull 抓取模型,我们需要配置一个抓取的 Scraper。可以利用 Prometheus Operator 为我们创建一个 Prometheus Agent,使用该 Agent 抓取 Node Exporter 的数据并使用 Remote Write 协议写入到 GreptimeDB Cluster 中。
Prometheus Agent 是 Prometheus 一种特殊的运行形态,本质上就是将时序数据库能力从 Prometheus 中剥离,并优化了 Remote Write 性能,从而让其成为了一个支持 Prometheus 采集语义的高性能 Agent。
可以用如下 YAML 配置来创建 Prometheus Agent:
yaml
apiVersion: v1
kind: ServiceAccount
metadata:
  name: prometheus-agent
---
apiVersion: rbac.authorization.k8s.io/v1
kind: ClusterRole
metadata:
  name: prometheus-agent
rules:
  - apiGroups: [""]
    resources:
      - nodes
      - nodes/metrics
      - services
      - endpoints
      - pods
    verbs: ["get", "list", "watch"]
  - apiGroups: [""]
    resources:
      - configmaps
    verbs: ["get"]
  - apiGroups:
      - discovery.k8s.io
    resources:
      - endpointslices
    verbs: ["get", "list", "watch"]
  - apiGroups:
      - networking.k8s.io
    resources:
      - ingresses
    verbs: ["get", "list", "watch"]
  - nonResourceURLs: ["/metrics"]
    verbs: ["get"]
---
apiVersion: rbac.authorization.k8s.io/v1
kind: ClusterRoleBinding
metadata:
  name: prometheus-agent
roleRef:
  apiGroup: rbac.authorization.k8s.io
  kind: ClusterRole
  name: prometheus-agent
subjects:
  - kind: ServiceAccount
    name: prometheus-agent
    namespace: node-exporter
---
apiVersion: monitoring.coreos.com/v1alpha1
kind: PrometheusAgent
metadata:
  name: prometheus-agent
spec:
  image: quay.io/prometheus/prometheus:v2.53.0
  replicas: 1
  serviceAccountName: prometheus-agent
  remoteWrite:
    - url: http://mycluster-frontend.default.cluster.svc.local:4000/v1/prometheus/write?db=public
  serviceMonitorSelector:
    matchLabels:
      team: node-exporter
抛开前面的权限配置,只需要关注 PrometheusAgent 的几个关键点 :
remoteWrite字段指定 Agent 的数据写入目标地址;serviceMonitorSelector指定 Agent 将为带有team=node-exporter Label的 ServiceMonitor 资源进行抓取,能更好地为 Scrape Job 做一些任务分片逻辑;
我们可以将 Prometheus Agent 创建在 node-exporter namespace 下:
bash
kubectl apply -f prometheus-agent.yaml -n node-exporter创建 ServiceMonitor
prometheus-operator 为业务监控抽象了两种模型: ServiceMonitor 和 PodMonitor。这两种模型本质差异不大,都是指示 prometheus-operator 需要监控的一组 Pod 的 Metrics 信息,从而生成 Prometheus Agent 的配置文件,并通过 HTTP POST 请求 /--/reload 来实时更新配置。
以下是为 Node Exporter 创建的 ServiceMonitor 示例:
bash
apiVersion: monitoring.coreos.com/v1
kind: ServiceMonitor
metadata:
  labels:
    team: node-exporter
  name: node-exporter
spec:
  endpoints:
    - interval: 5s
      targetPort: 9100
  selector:
    matchLabels:
app.kubernetes.io/name: prometheus-node-exporter该配置的意义在于:对带有 app.kubernetes.io/name=prometheus-node-exporter Label 的 Service, 每 5 秒抓取其后端 Pod 的 9100 端口的 /metrics 数据。
值得注意的是:ServiceMonitor 的 .metadata.labels 字段中的 team=node-exporter 必须与相应 Prometheus Agent 的 matchLabels 匹配。
让我们将 ServiceMonitor 创建于 node-exporter namespace 中:
bash
kubectl apply -f service-monitor.yaml -n node-exporter观测
创建所有资源后,写入行为便会开始,可以使用 kubectl port-forward 命令暴露 Frontend 服务,并用 mysql 进行查询:
bash
kubectl port-forward svc/mycluster-frontend.default.cluster.svc.local 4002:4002执行查询后将看到类似下面的表格:
yaml
mysql> show tables;
+---------------------------------------------+
| Tables                                      |
+---------------------------------------------+
| go_gc_duration_seconds                      |
| go_gc_duration_seconds_count                |
| go_gc_duration_seconds_sum                  |
| go_goroutines                               |
| go_info                                     |
| go_memstats_alloc_bytes                     |
| go_memstats_alloc_bytes_total               |
...
为了进一步证明 GreptimeDB 对 PromQL 的兼容性,可以使用 Grafana 和 Node Exporter Dashboard 进行数据可视化。安装 Grafana 的步骤如下:
- 添加 Grafana 的 Helm Repo:
bash
helm repo add grafana https://grafana.github.io/helm-charts
helm repo update- 使用默认配置部署 Grafana:
bash
helm upgrade \
  --install grafana grafana/grafana \
  --set image.registry=docker.io \
  --create-namespace \
-n grafana- 部署完成后,使用以下命令查看 admin 用户的密码:
bash
kubectl get secret \
  -n grafana grafana \
-o jsonpath="{.data.admin-password}" | base64 --decode ; echo- 将 Grafana 的服务暴露到宿主机以方便用浏览器访问:
bash
kubectl -n grafana port-forward --address 0.0.0.0 svc/grafana 18080:80此时我们可以直接在宿主机浏览器输入 http://localhost:18080 访问 Grafana 服务,并以 admin 用户名和上一步中获得的密码进行登录;
部署完 Grafana 之后,我们可以将 GreptimeDB Cluster 添加为标准的 Prometheus Source:
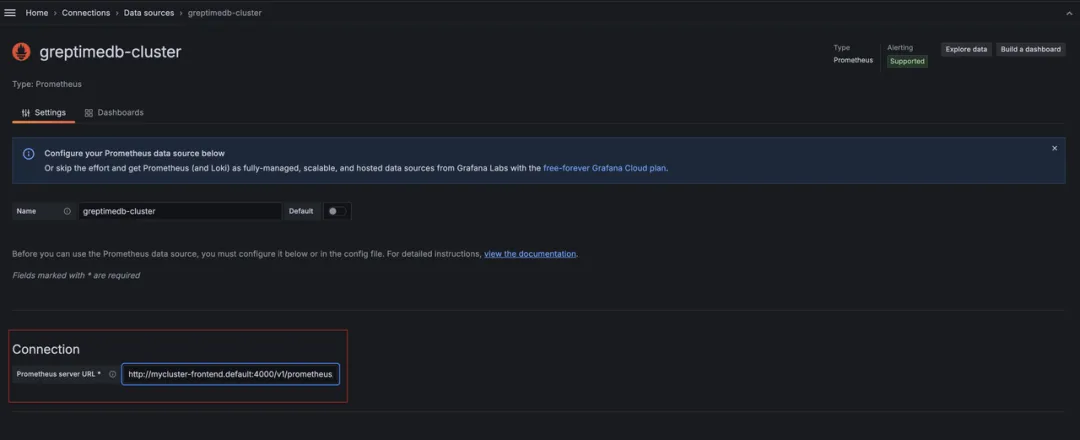
只需要在 Connection 中填写 Frontend 服务的内网域名即可:http://mycluster-frontend.default.cluster.svc.local:4000/v1/prometheus/。
然后点击 Save and Test 即可。
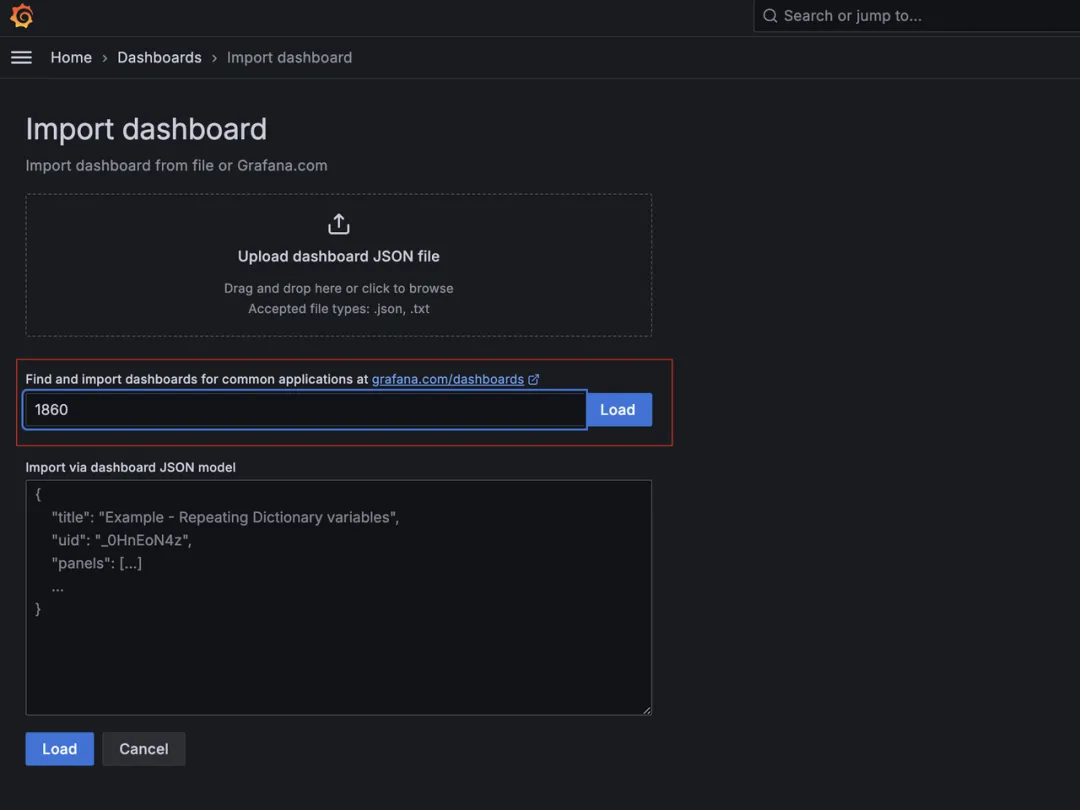
我们通过 ID 导入 Node Exporter 的 Dashboard:
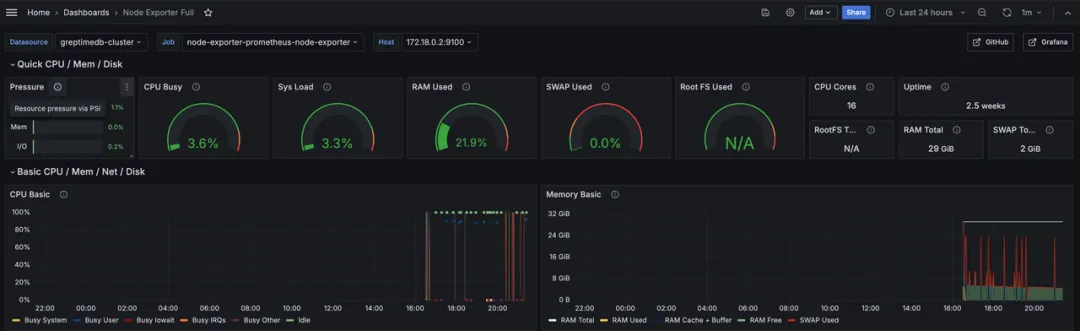
使用我们刚添加的 greptimedb-cluster 源,我们既可以看到熟悉的 Node Exporter Dashboard:
更进一步
从上述体验中可以看到,GreptimeDB 对 Prometheus 生态的完美兼容性使我们能够轻松复用现有组件。如果你已经在使用 Prometheus Operator 进行数据监控,可以在不改变现有业务的前提下创建新的 Prometheus Agent 和 ServiceMonitor 来实现数据的双写,等验证没有问题后再将旧的数据迁移到新集群中并逐步切换流量。未来我们将提供相应的迁移工具和文章来进一步介绍方案。
细心的你也一定观察到,上文中我们并没有使用对象存储,而是使用了本地存储,这其实是为了能更方便地做演示。其实我们可以为集群配置上对象存储,从而让相对廉价的对象存储作为我们最终的后端存储。如果您对此感兴趣,可以关注我们后续的文章,我们将介绍如何在云环境中部署 GreptimeDB。
随着集群内的业务增加,GreptimeDB 集群也需要进行弹性伸缩,这时候我们可以为其设计更合理的分区规则来弹性扩容 Frontend 和 Datanode 服务。在大多数场景下,我们只需要扩容这两种类型的服务就可以很好地应对系统压力。我们将在后续文章中详细介绍如何实现更合理的弹性扩容策略。
关于 Greptime
Greptime 格睿科技专注于为可观测、物联网及车联网等领域提供实时、高效的数据存储和分析服务,帮助客户挖掘数据的深层价值。目前基于云原生的时序数据库 GreptimeDB 已经衍生出多款适合不同用户的解决方案,更多信息或 demo 展示请联系下方小助手(微信号:greptime)。
欢迎对开源感兴趣的朋友们参与贡献和讨论,从带有 good first issue 标签的 issue 开始你的开源之旅吧~期待在开源社群里遇见你!添加小助手微信即可加入“技术交流群”与志同道合的朋友们面对面交流哦~
Star us on GitHub Now: https://github.com/GreptimeTeam/greptimedb
Twitter: https://twitter.com/Greptime
Slack: https://greptime.com/slack


