本页内容
TL;DR: I'm using GreptimeDB to collect OpenTelemetry metrics from Claude Code. It's an awesome setup because GreptimeDB has great OTLP support and uses Perses, which lets me define my monitoring dashboard as a simple configuration file.
I've been an avid user of Anthropic's Claude Code for a while now, and it's been a fantastic coding companion. As a developer, I'm always on the lookout for ways to understand and improve my own efficiency. Am I getting faster? Am I writing more code? And, let's be honest, how much is this powerful tool costing me?
There's a great command-line tool called ccusage that provides a quick snapshot of your usage, and it works wonderfully for a quick check-in. But then I stumbled upon something that sparked my inner data-hoarding goblin: Claude Code has native support for OpenTelemetry (OTLP). The moment I saw that, I knew what I had to do. My collector's instinct kicked in, and I decided it was time to build my own monitoring dashboard.
Choosing My Database: Why GreptimeDB?
The first piece of the puzzle was selecting a database to store all this juicy telemetry data. My choice was pretty straightforward: GreptimeDB. I'd used it before and had a great experience. Here’s why it was the perfect fit for this project:
- Cloud and Local Flexibility: GreptimeDB offers both a serverless cloud version and a local, open-source binary. This was a huge plus. I could start quickly with GreptimeDB Cloud for initial testing and prototyping. If I ever become more concerned about data privacy or want more granular control, I can easily migrate to a self-hosted instance.
- First-Class OpenTelemetry Support: The integration with OpenTelemetry is seamless. GreptimeDB is designed to handle time-series data like this out of the box, which meant less friction and a quicker setup for me. You can check out their OTLP documentation here.
- Dashboard as Code with Perses: GreptimeDB uses Perses for its dashboards. I'm a huge fan of the "Dashboard as Code" philosophy. Instead of tediously clicking around a UI to build and tweak my charts, I can define my entire dashboard in a single YAML file. This makes it versionable, easily reusable, and incredibly simple to share.
The Metrics I Cared About
With the database chosen, I started to map out exactly what I wanted to see on my dashboard. I wanted to go beyond the basics and get a comprehensive view of my coding habits with Claude. Here are the key metrics I decided to track:
- Recent Cost: How much have I spent in the last day, week, or month? This is the bottom line for keeping my budget in check.
- Recent Token Usage: A great proxy for my overall interaction volume. I was especially curious to see the breakdown between input and output tokens.
- Recent Code Lines: How many lines of code has Claude helped me generate or modify? This feels like a direct measure of productivity.
- Active Sessions: A simple metric to see how many distinct coding sessions I'm initiating over time.
- Metric Breakdowns: I wanted to slice and dice the data for deeper insights. The official Claude Code documentation on monitoring lists some fascinating attributes. I was particularly interested in seeing breakdowns by
model,action(e.g.,write,edit), andtype.
The Setup: A Surprisingly Simple Affair
Getting everything up and running was refreshingly painless.
1. The Data Collector: GreptimeDB Cloud
As I mentioned, I started with GreptimeDB Cloud to get the data flowing. The setup was a breeze. I just created a new service and was provided with an OTLP endpoint and the necessary credentials.
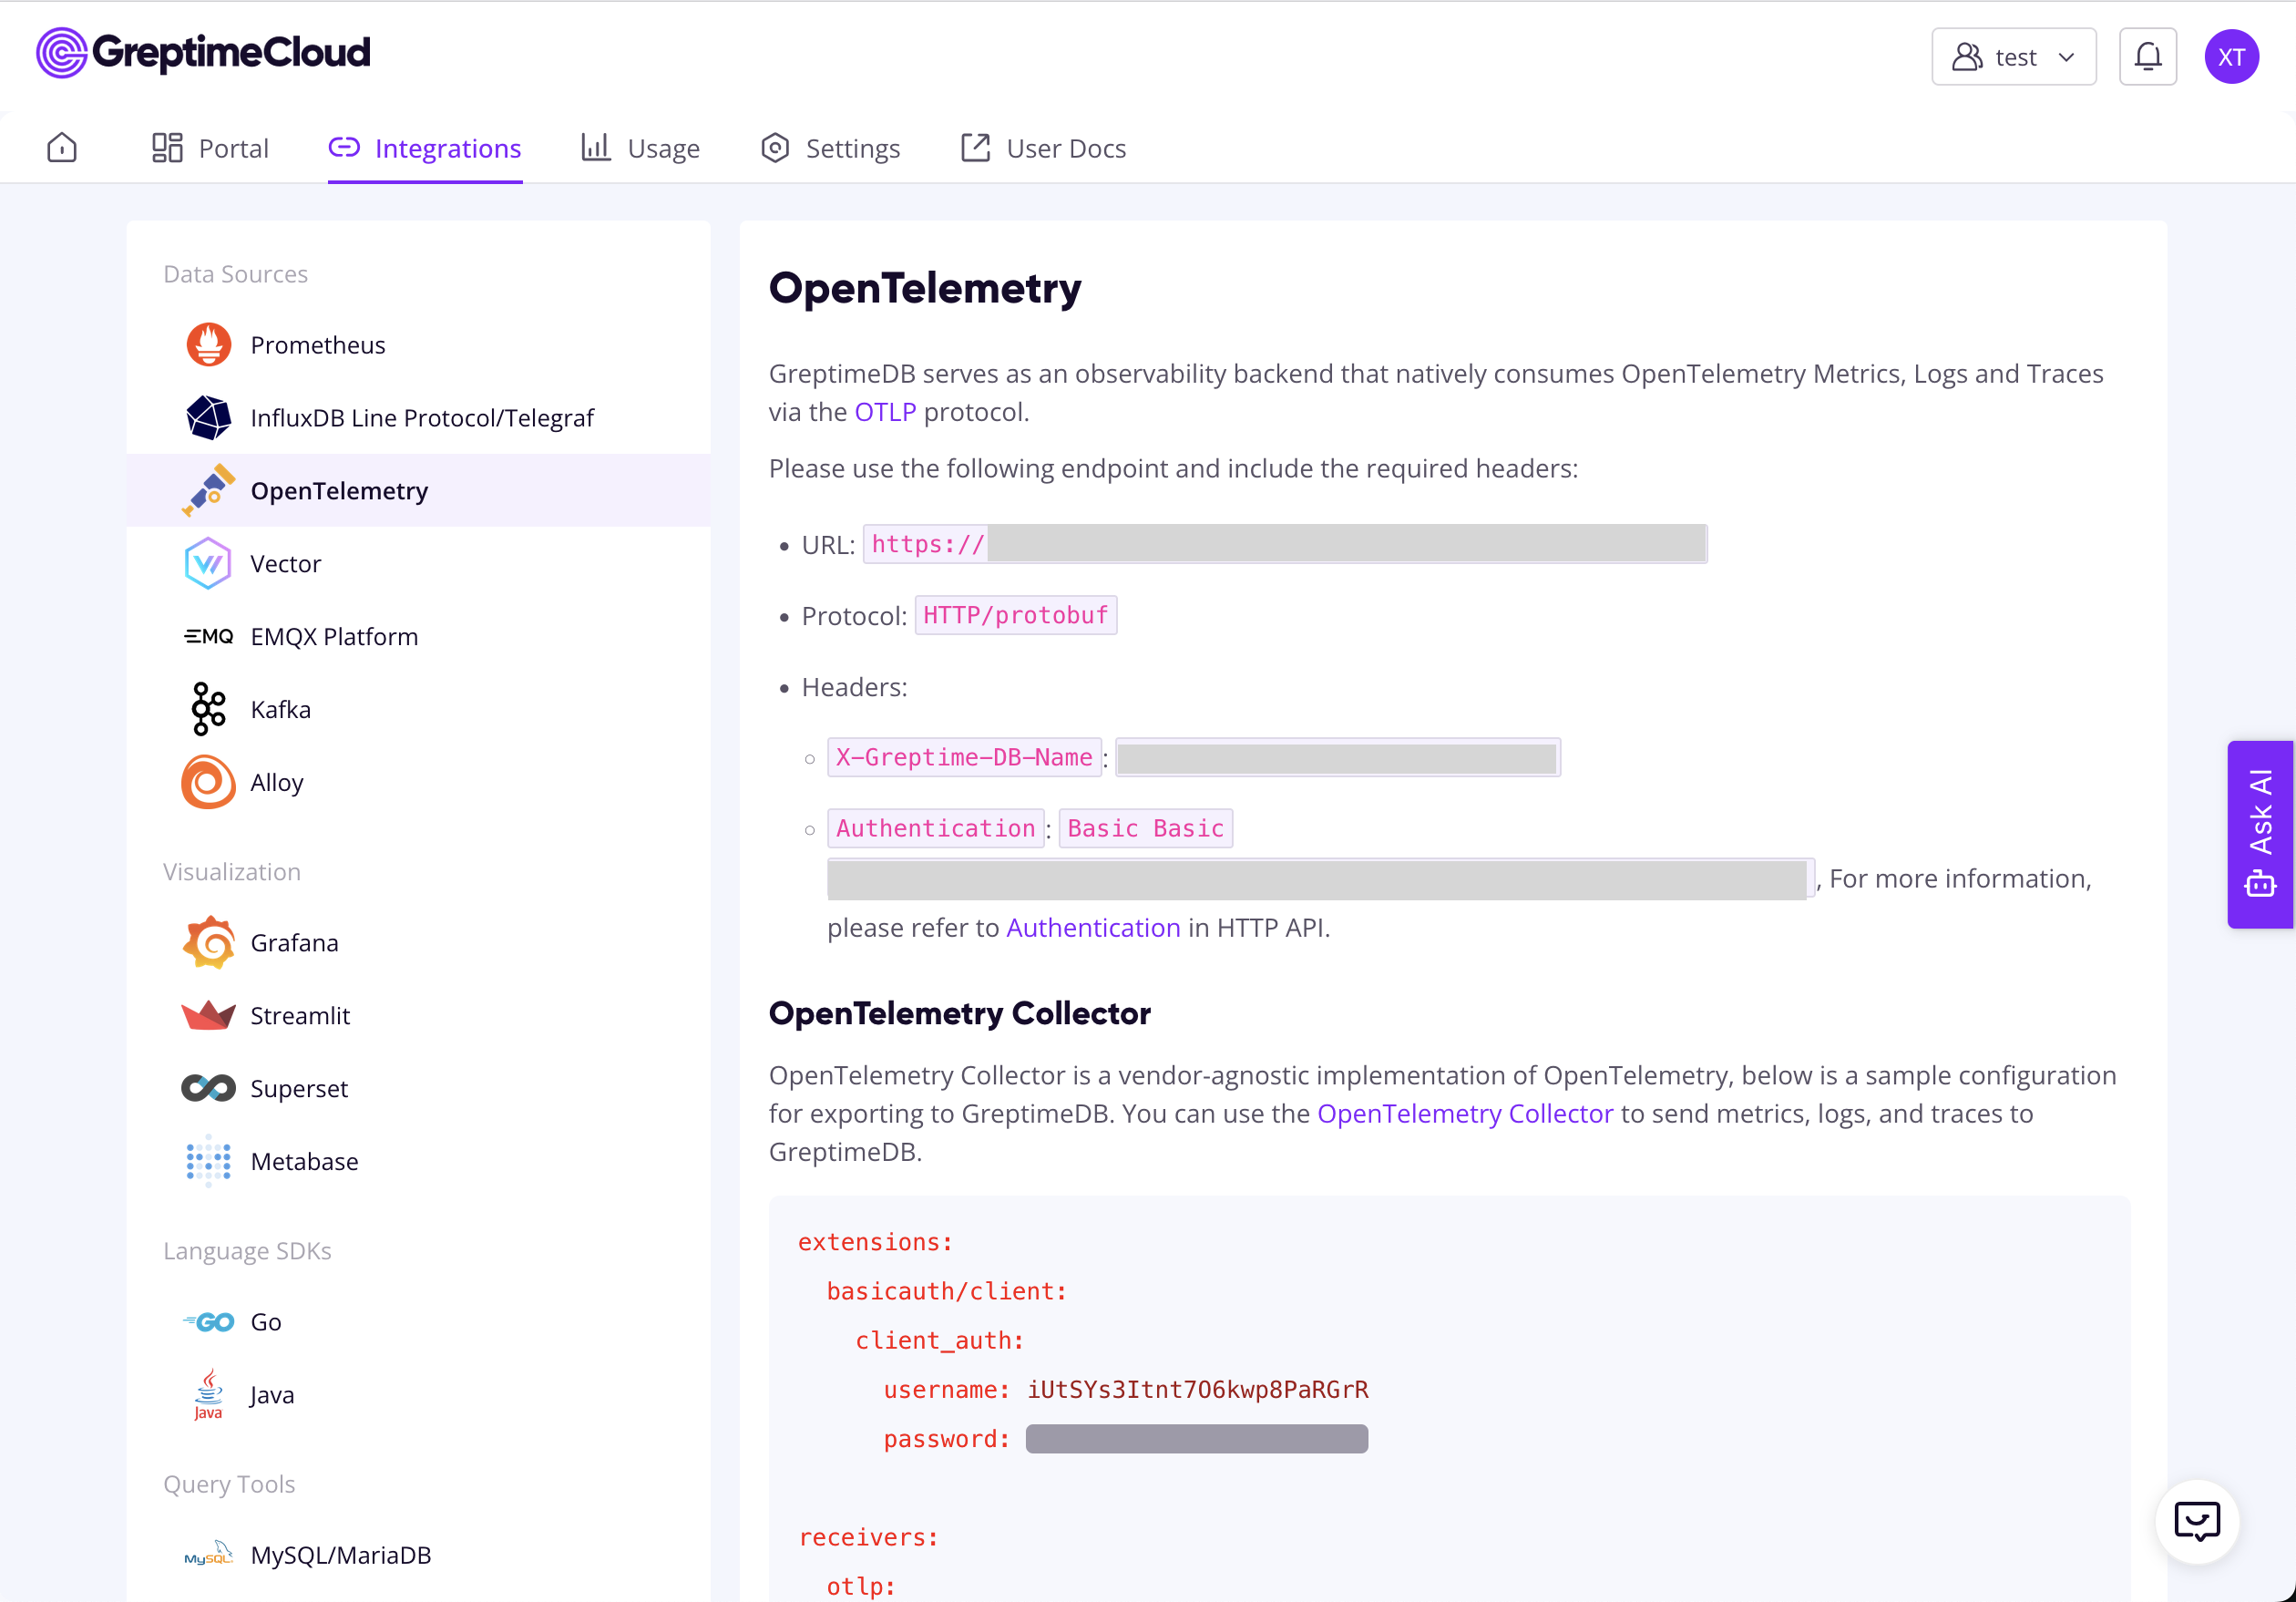
2. Configuring Claude Code
Next, I needed to tell Claude Code where to send its telemetry data. Following the official guide, this was as simple as adding a few variables in Claude Code setting files (e.g., ~/.claude/settings.json). Notice there are two variables to substitute your-base64-encoded-credentials and your-database-name. You can get them from "Integrations" -> "OpenTelemetry" tab:
json
    "CLAUDE_CODE_ENABLE_TELEMETRY": "1",
    "OTEL_METRICS_EXPORTER": "otlp",
    "OTEL_LOGS_EXPORTER": "otlp",
    "OTEL_EXPORTER_OTLP_PROTOCOL": "http/protobuf",
    "OTEL_EXPORTER_OTLP_ENDPOINT": "<your-greptimedb-otlp-endpoint>",
    "OTEL_EXPORTER_OTLP_HEADERS": "Authorization=Basic <your-base64-encoded-credentials>,X-Greptime-DB-Name=<your-database-name>"
    "OTEL_METRIC_EXPORT_INTERVAL": "10000",
    "OTEL_LOGS_EXPORT_INTERVAL": "5000"
And... that was it. Seriously. Claude Code immediately started sending metrics to my GreptimeDB instance.
3. Building the Dashboard: A Little Help from a Friend
Now for the fun part: visualizing the data. Since GreptimeDB uses Perses, I knew I'd be working with YAML. To get a head start, I did something a bit meta: I asked Claude Code to generate a basic Perses dashboard configuration for the metrics I wanted to track. It gave me a fantastic, usable starting point that saved me a ton of time.
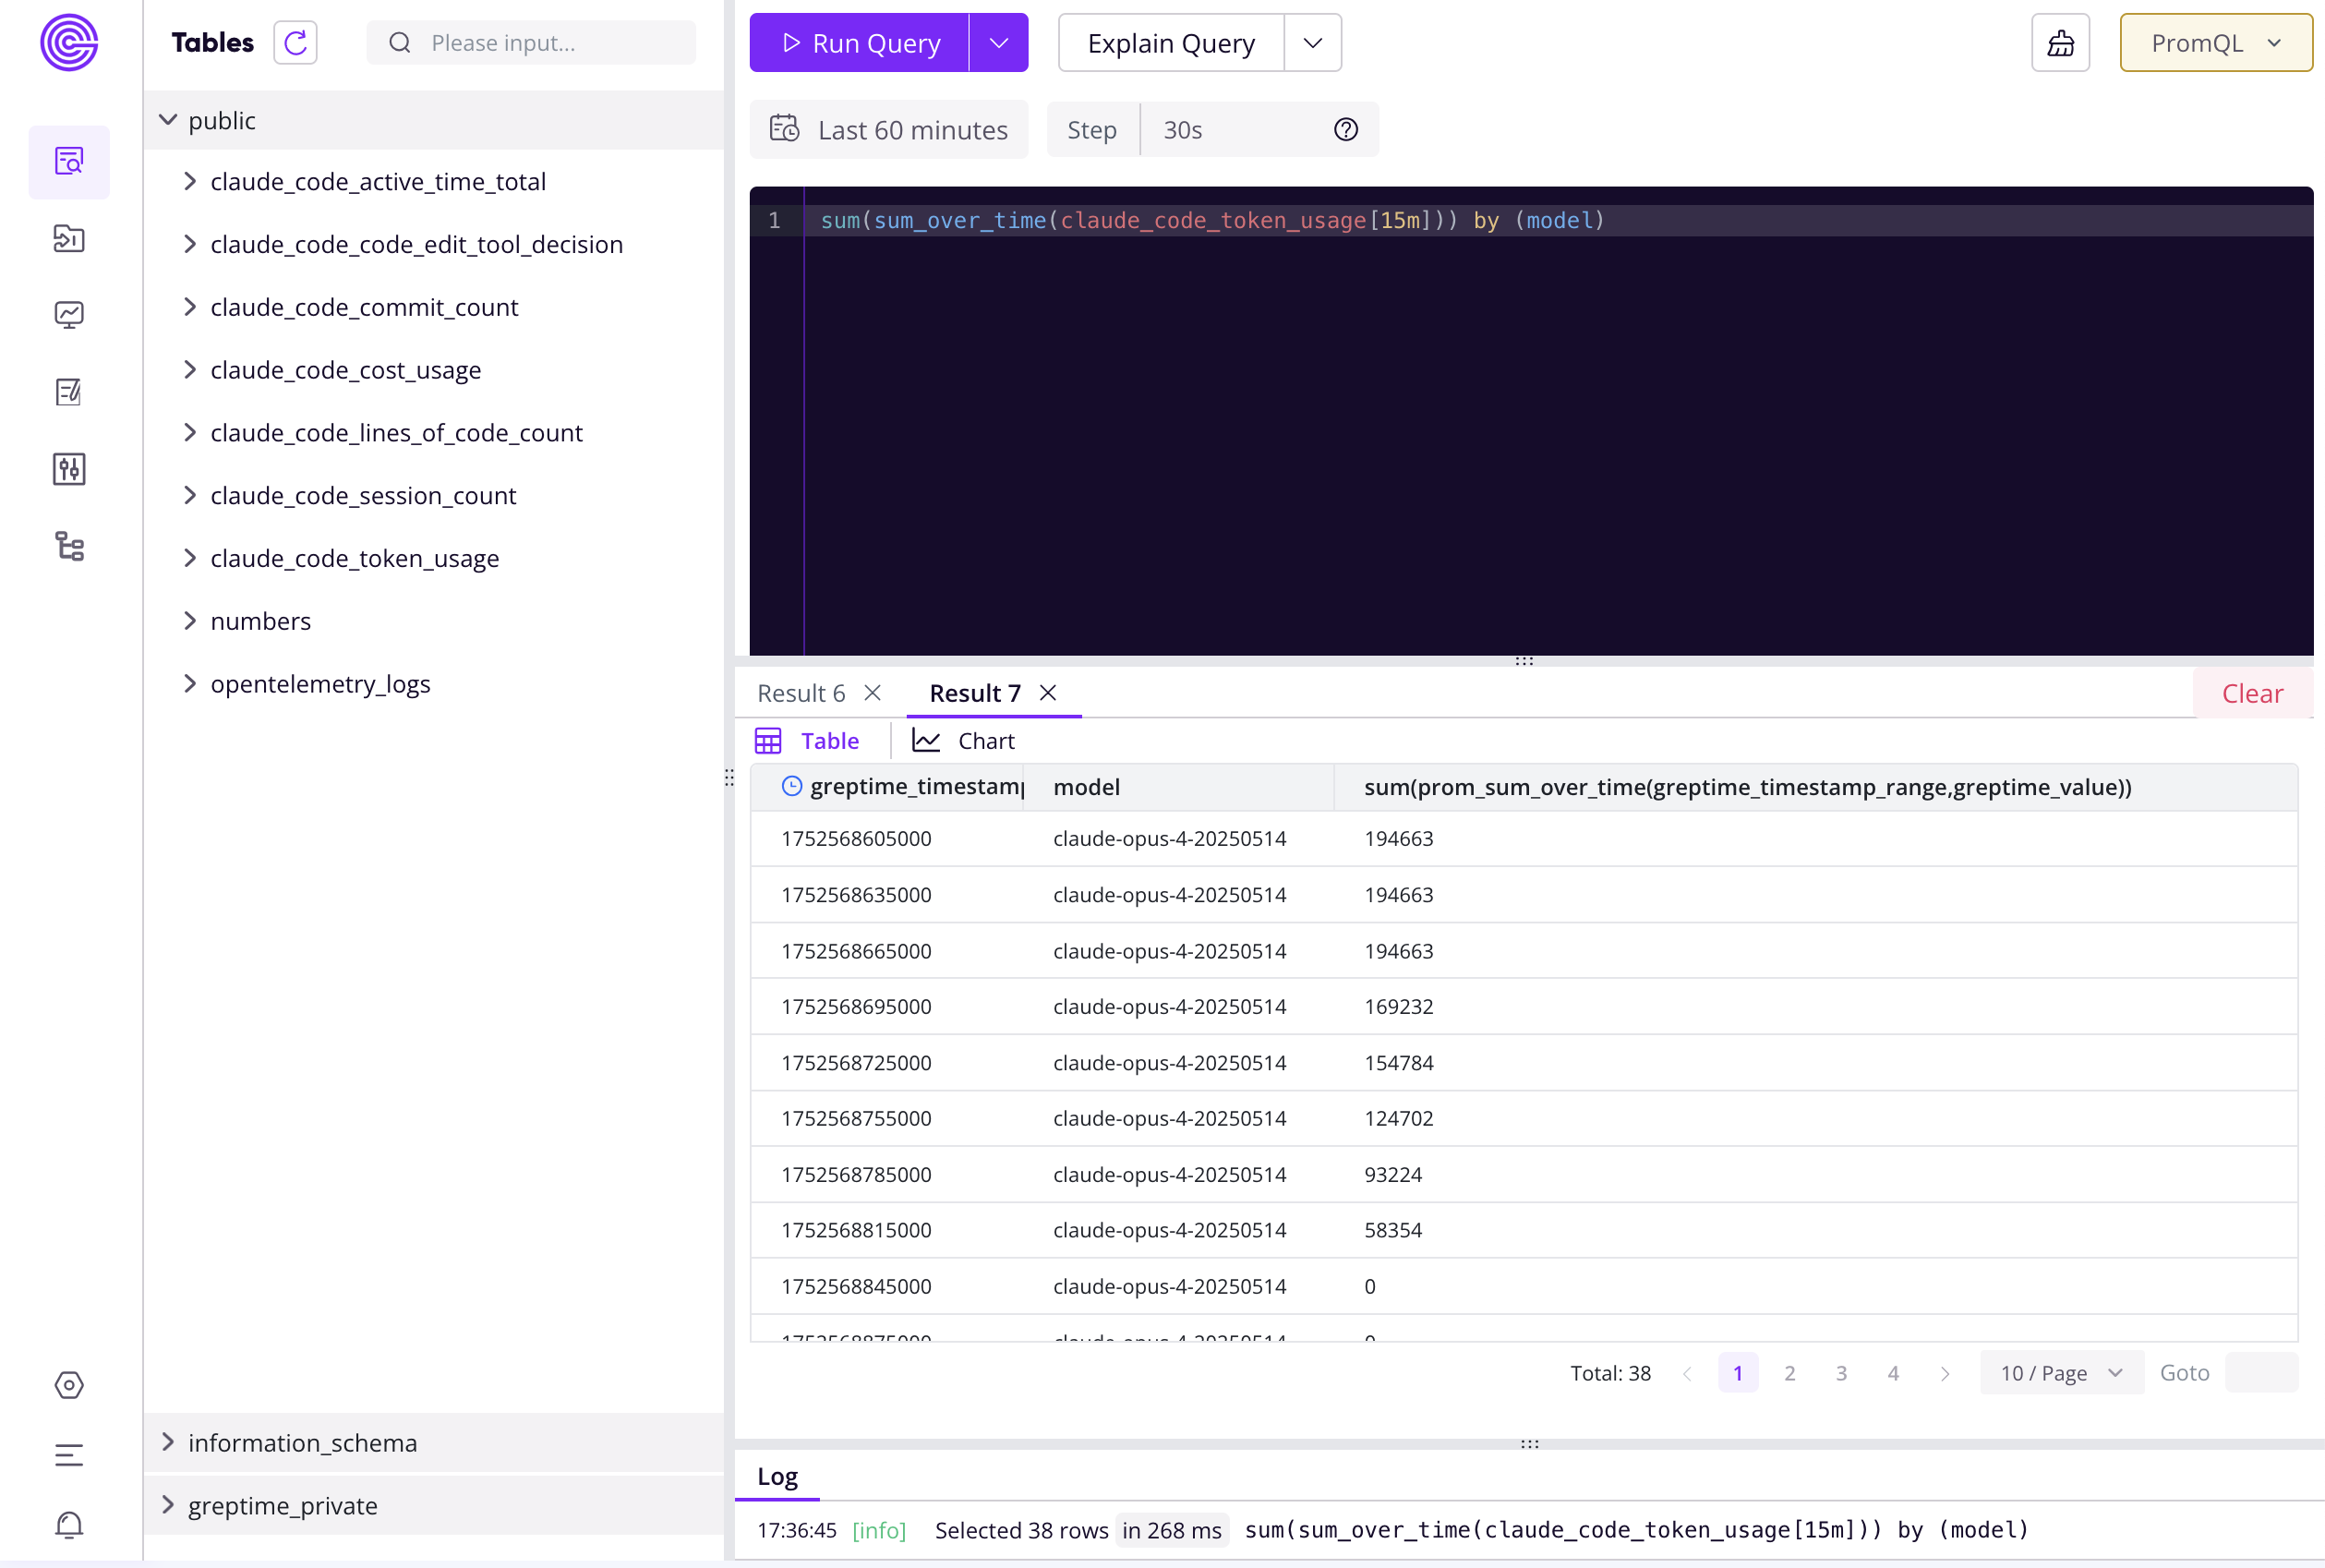
However, I did encounter one interesting little snag. Many of the metrics from Claude Code have "Count" in their name, for example, claude.code.lines_of_code.count. My AI assistant (and frankly, me too at first) naturally assumed these were Counter metric types. In the world of Prometheus Query Language (PromQL), you would typically use the increase() function to calculate the rate of change for a counter.
But here’s the catch: the metrics Claude Code sends are actually deltas, not absolute, ever-increasing counters. They represent the change since the last time a metric was exported. This means that instead of increase(), I needed to use a function like sum_over_time() to correctly aggregate these incremental values.
So, a query for token usage that might have initially looked like this:
promql
# Incorrect for this use case
increase(claude_code_lines_of_code_count[${__rate_interval}])
Needed to be adjusted to this:
promql
# Correct for summing deltas
sum_over_time(claude_code_lines_of_code_count[${__rate_interval}])
It was a small but crucial change to ensure my graphs were accurate. After a bit more tweaking and refining my PromQL queries, I had a dashboard I was really happy with.
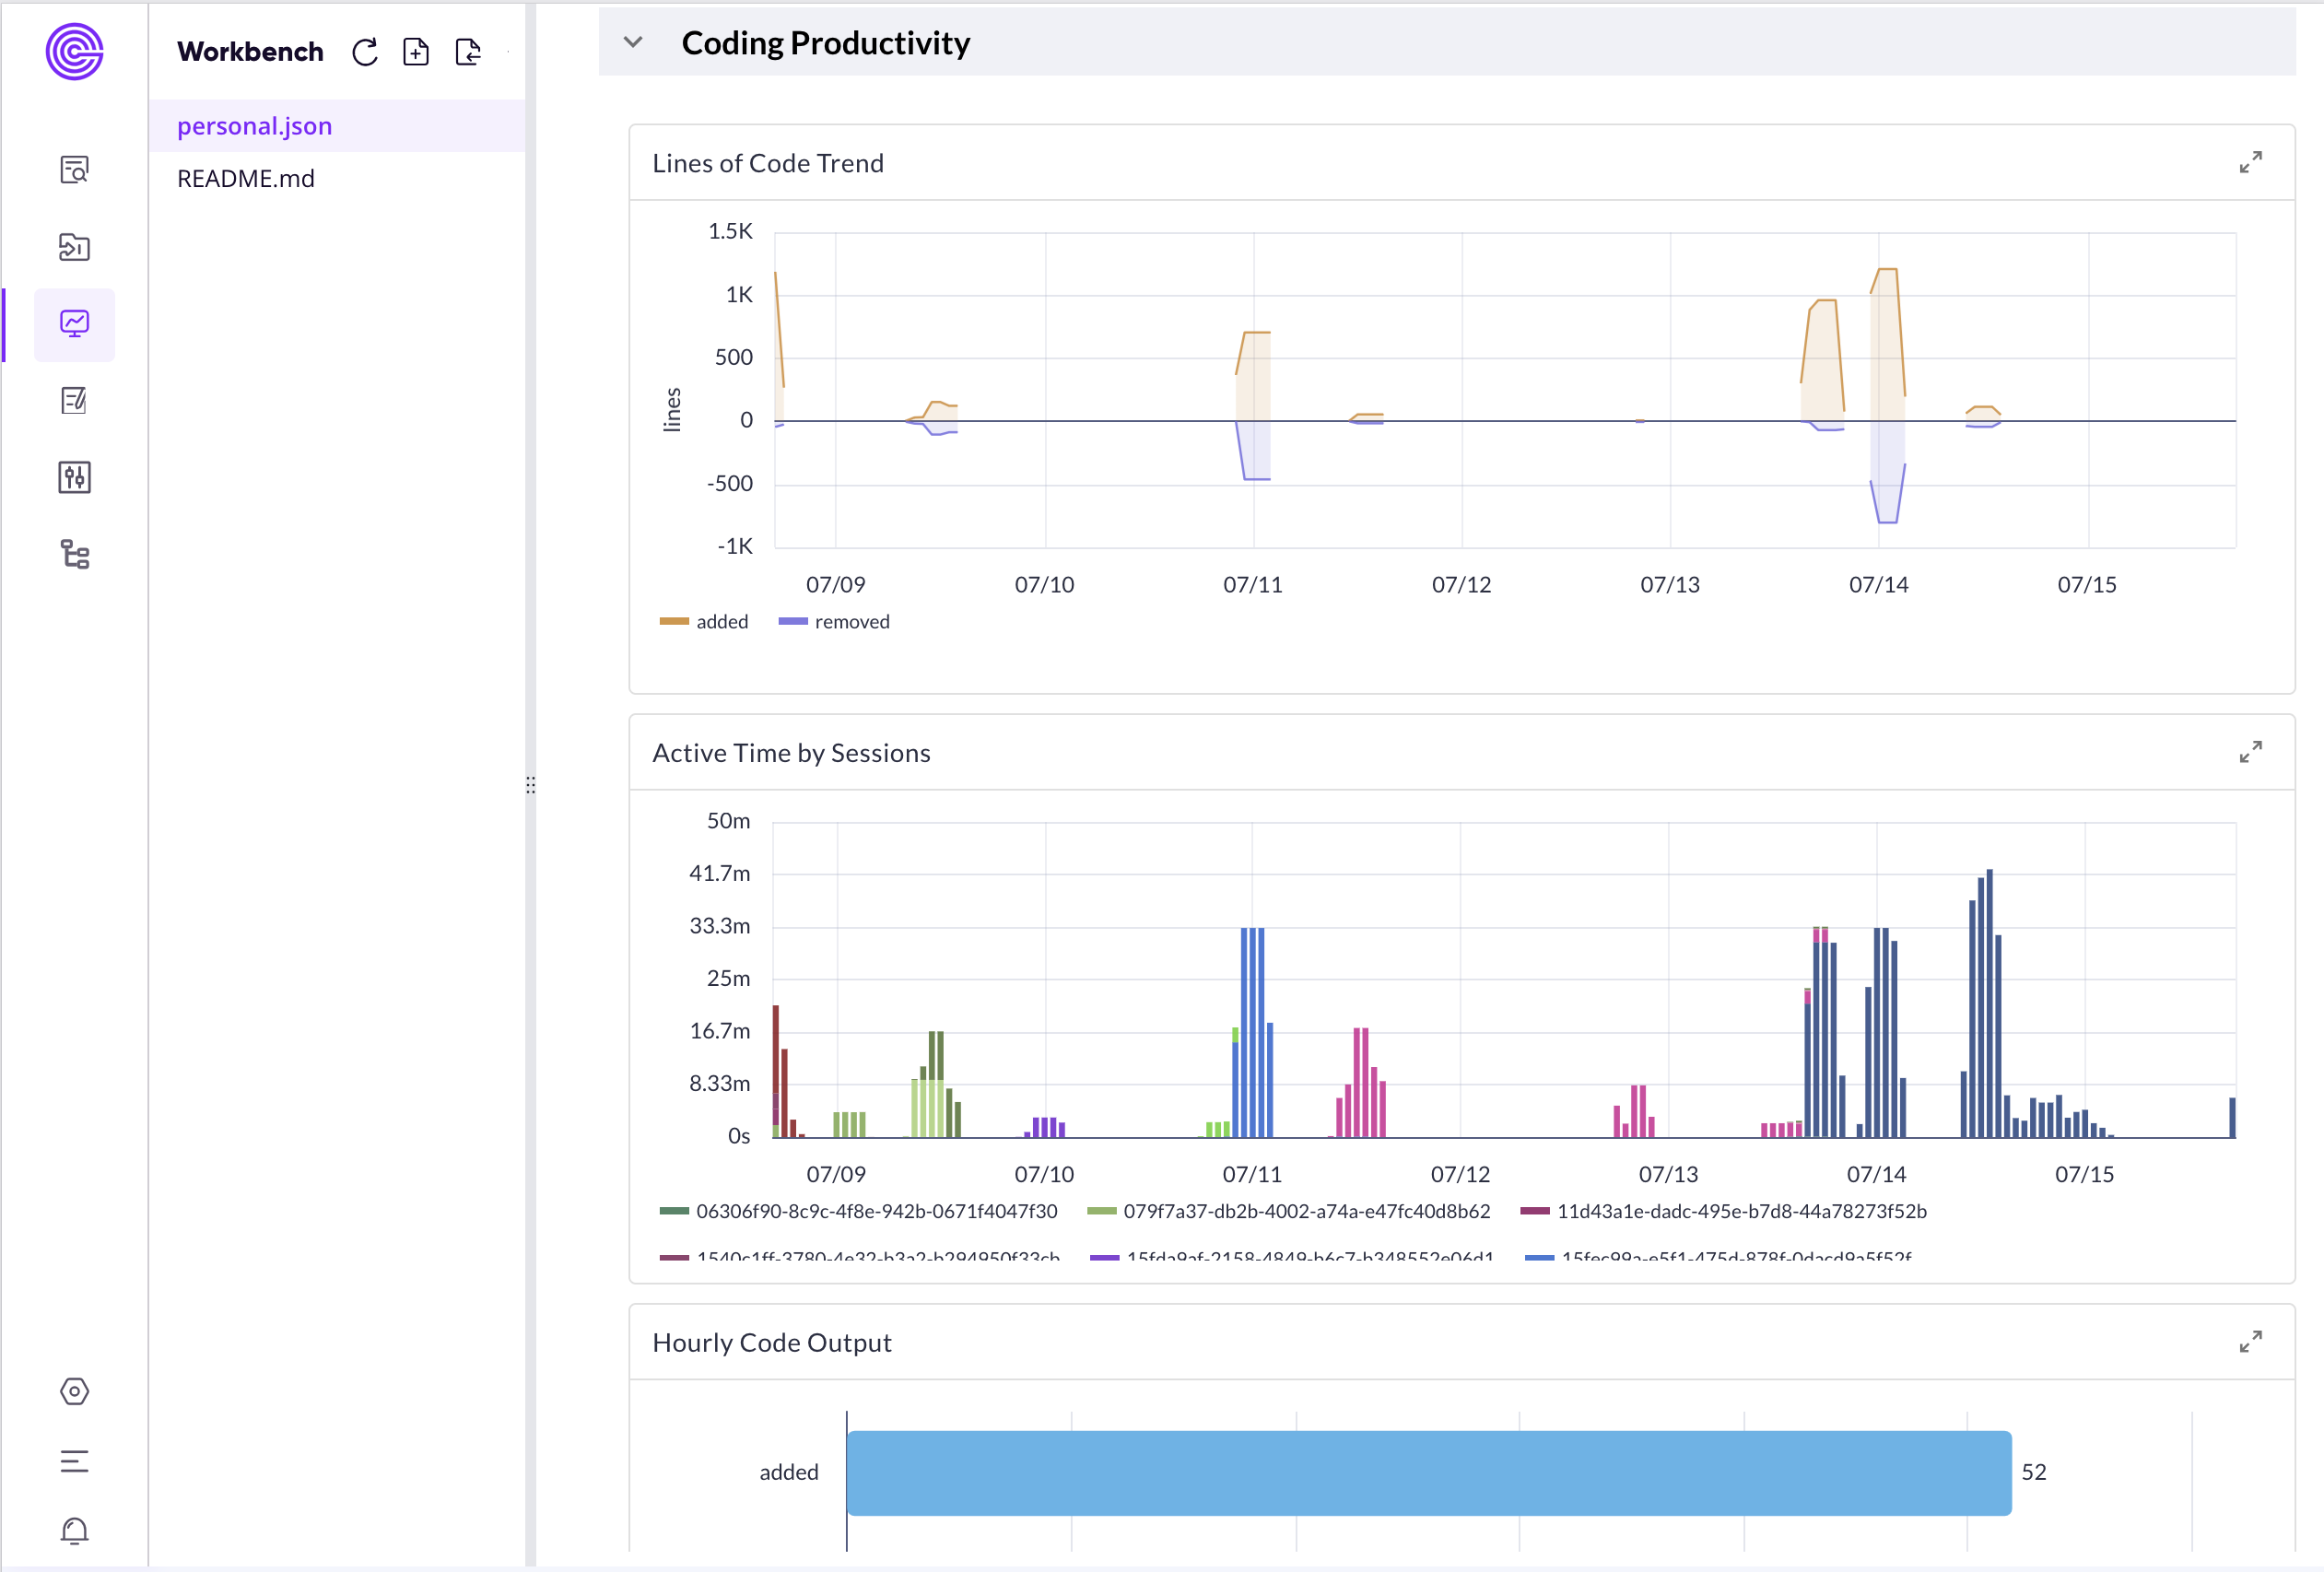
The Final Result
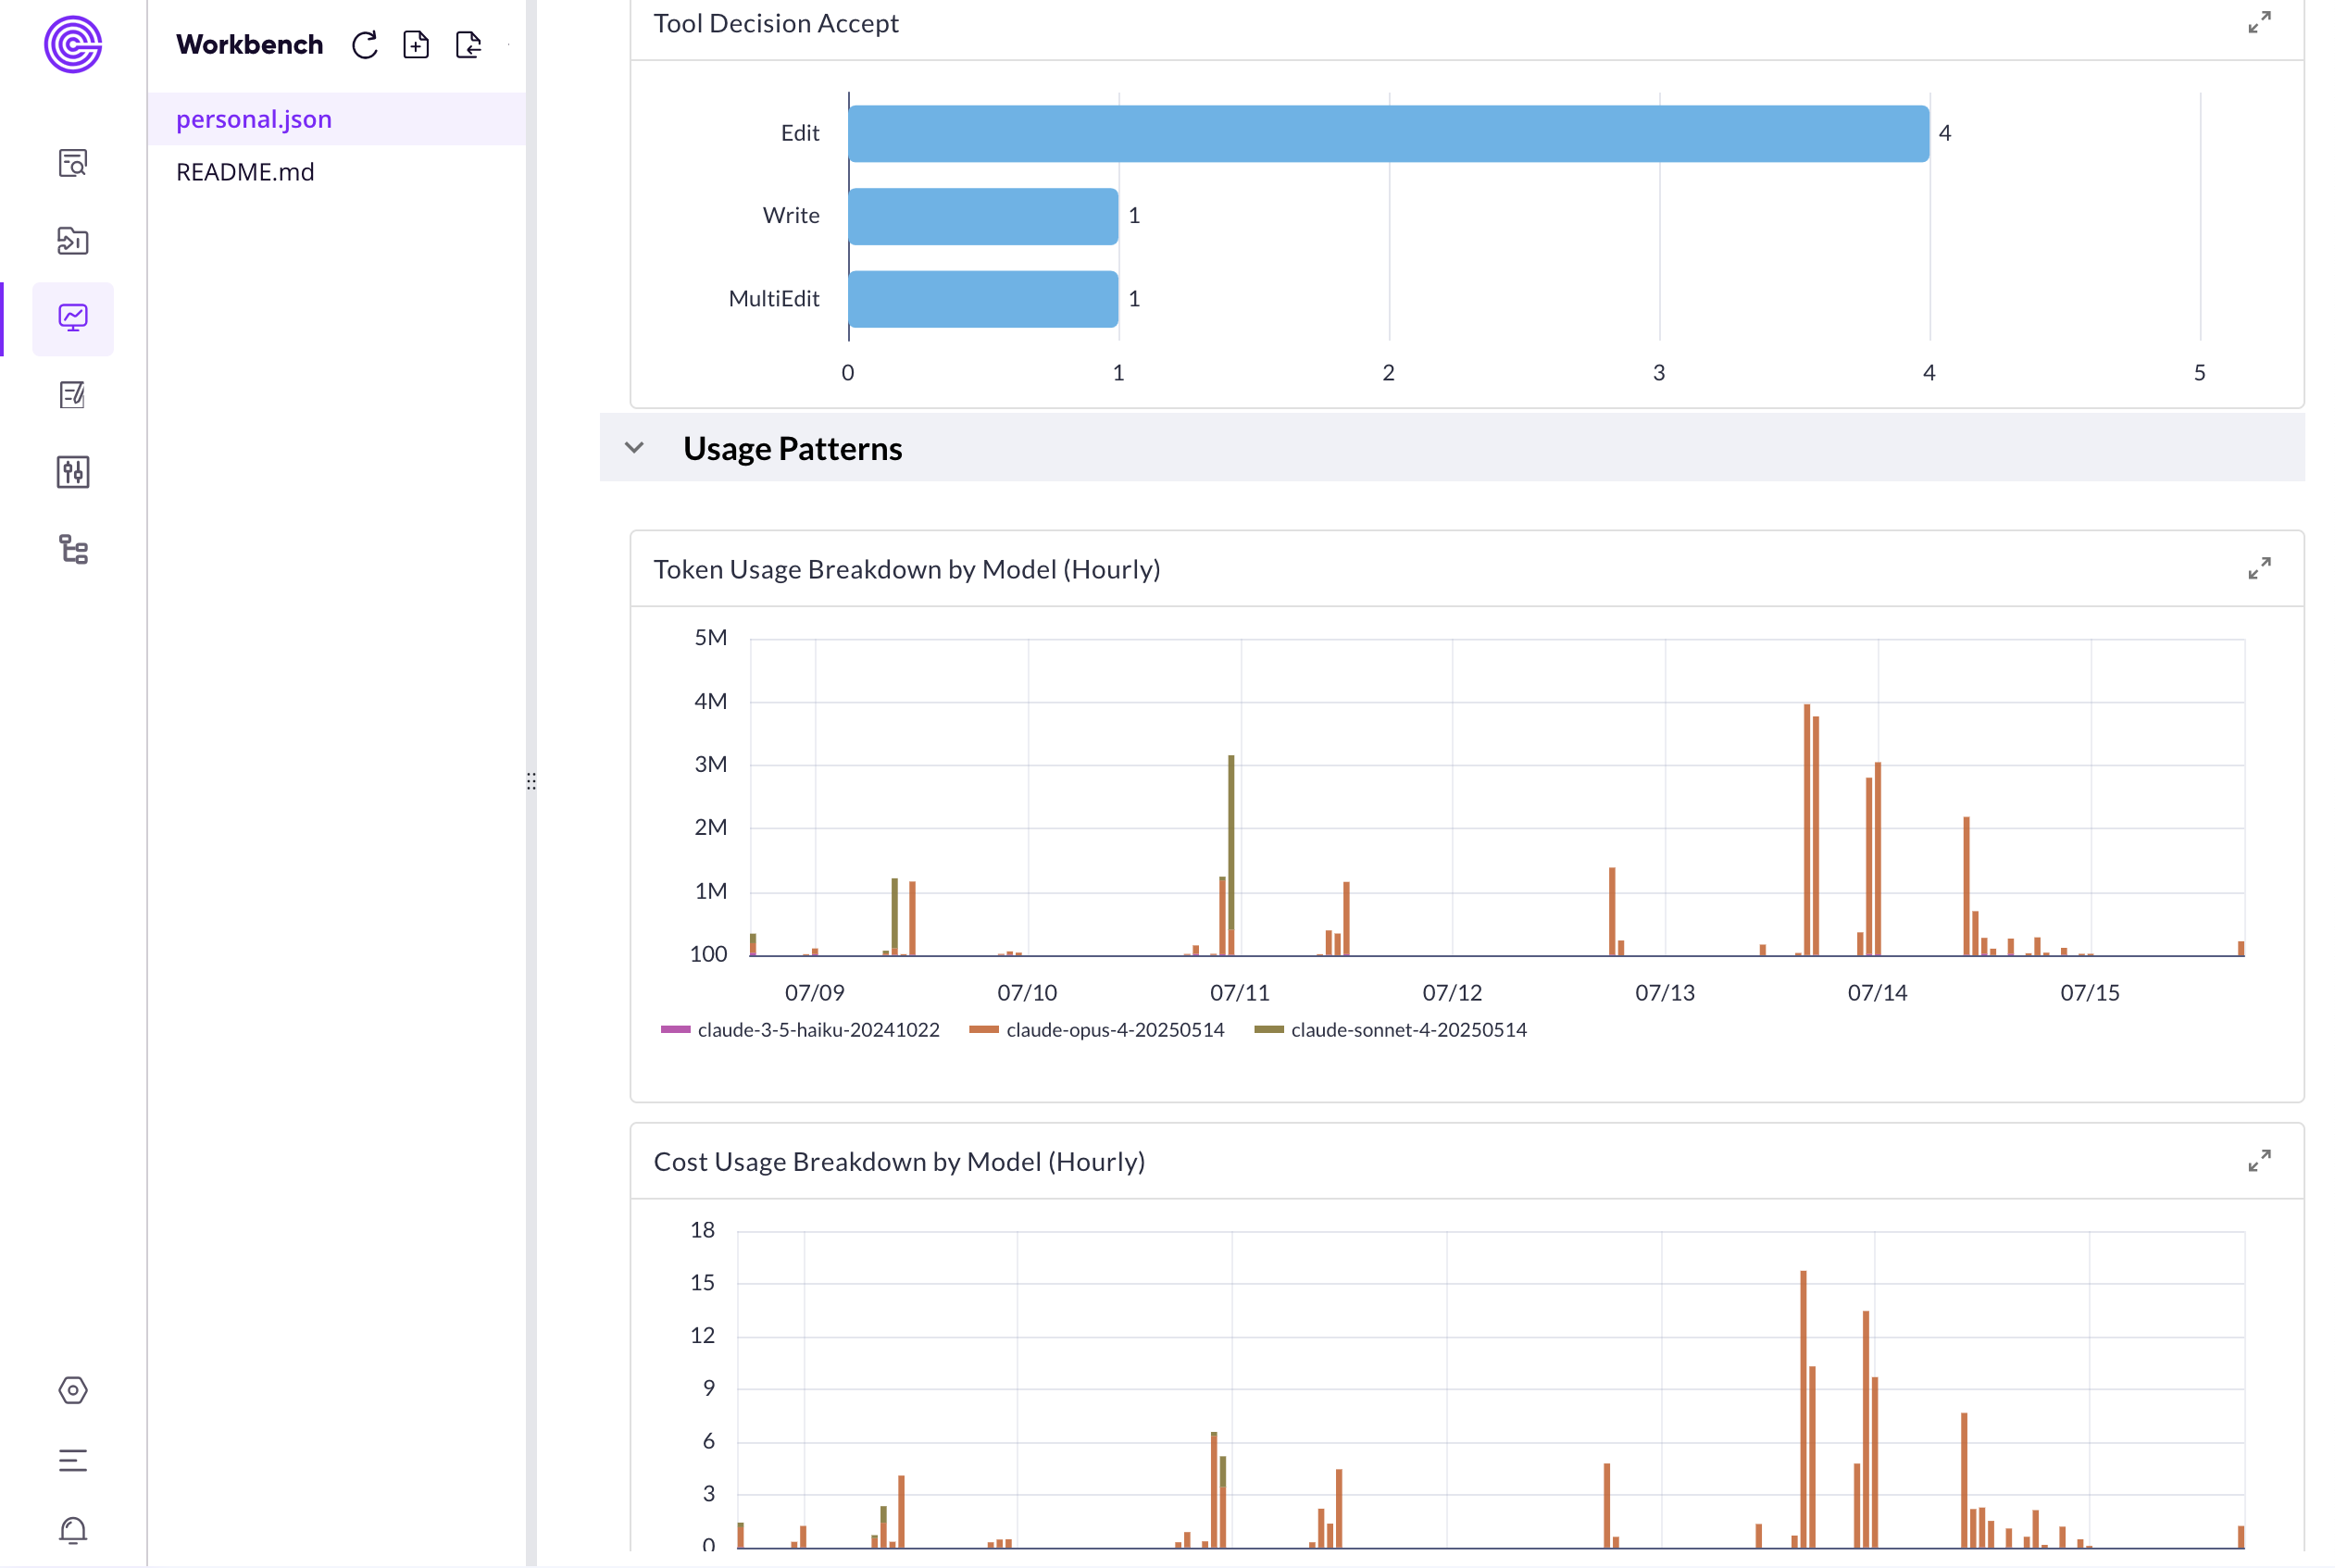
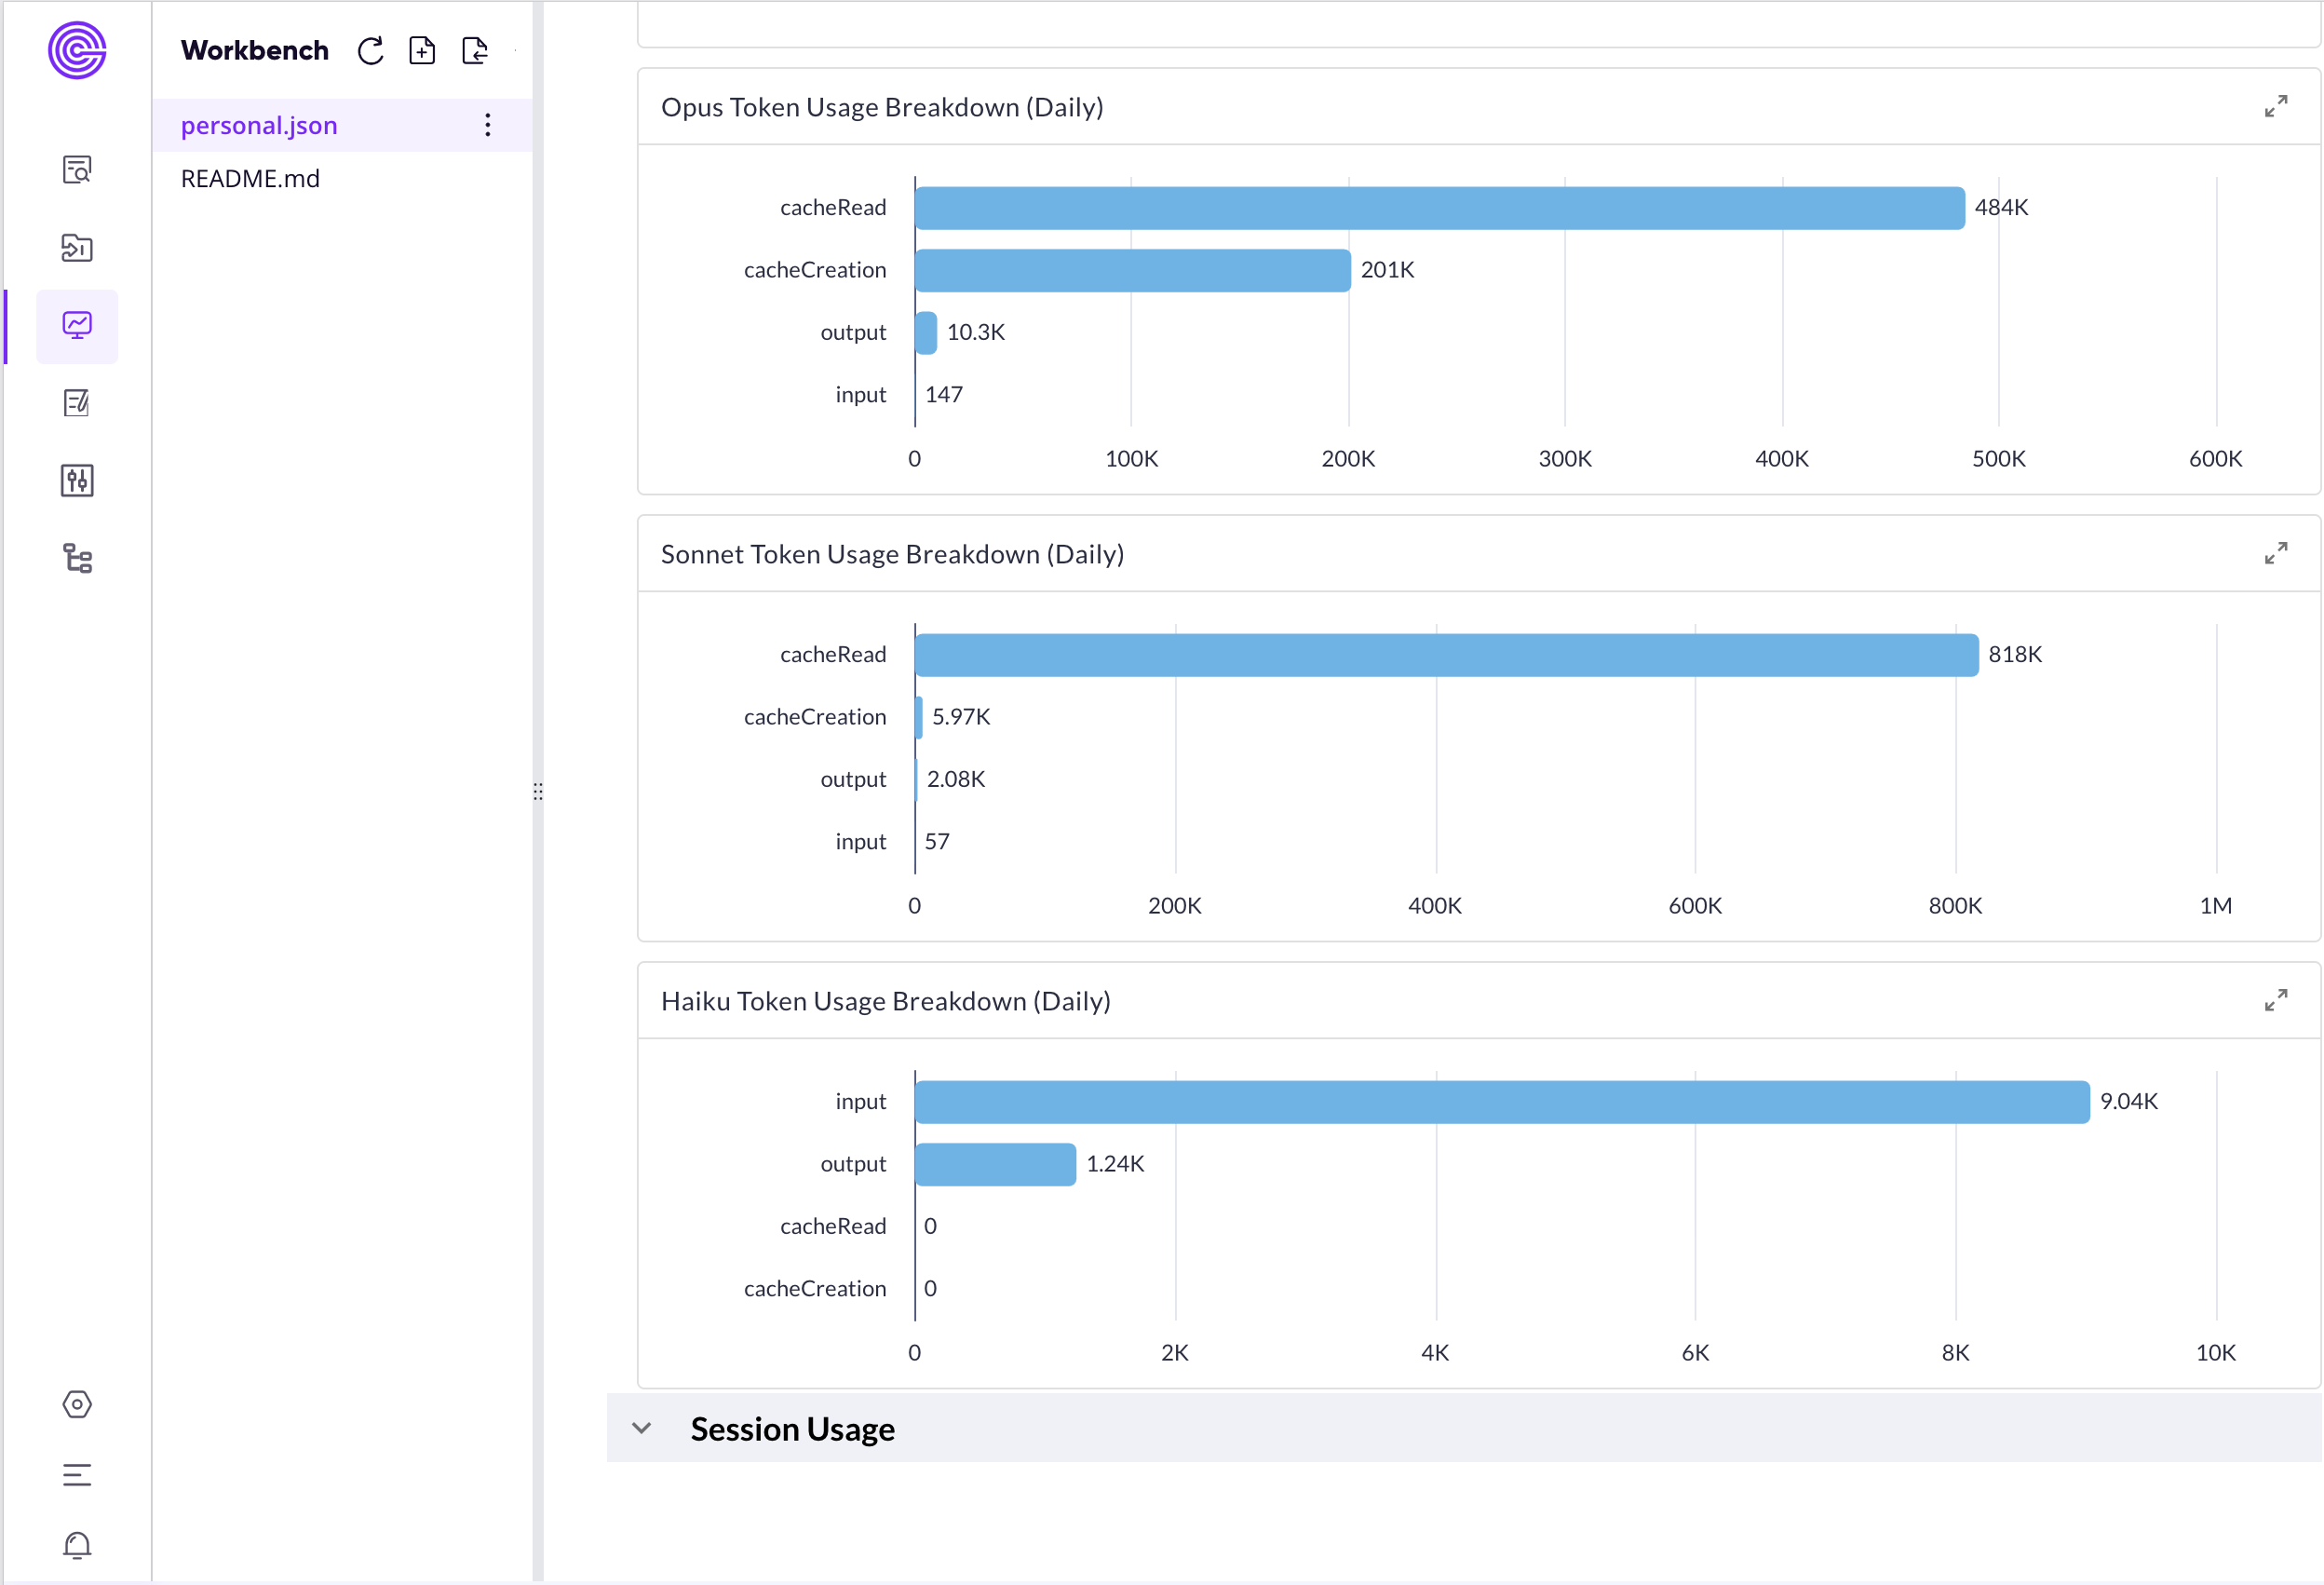
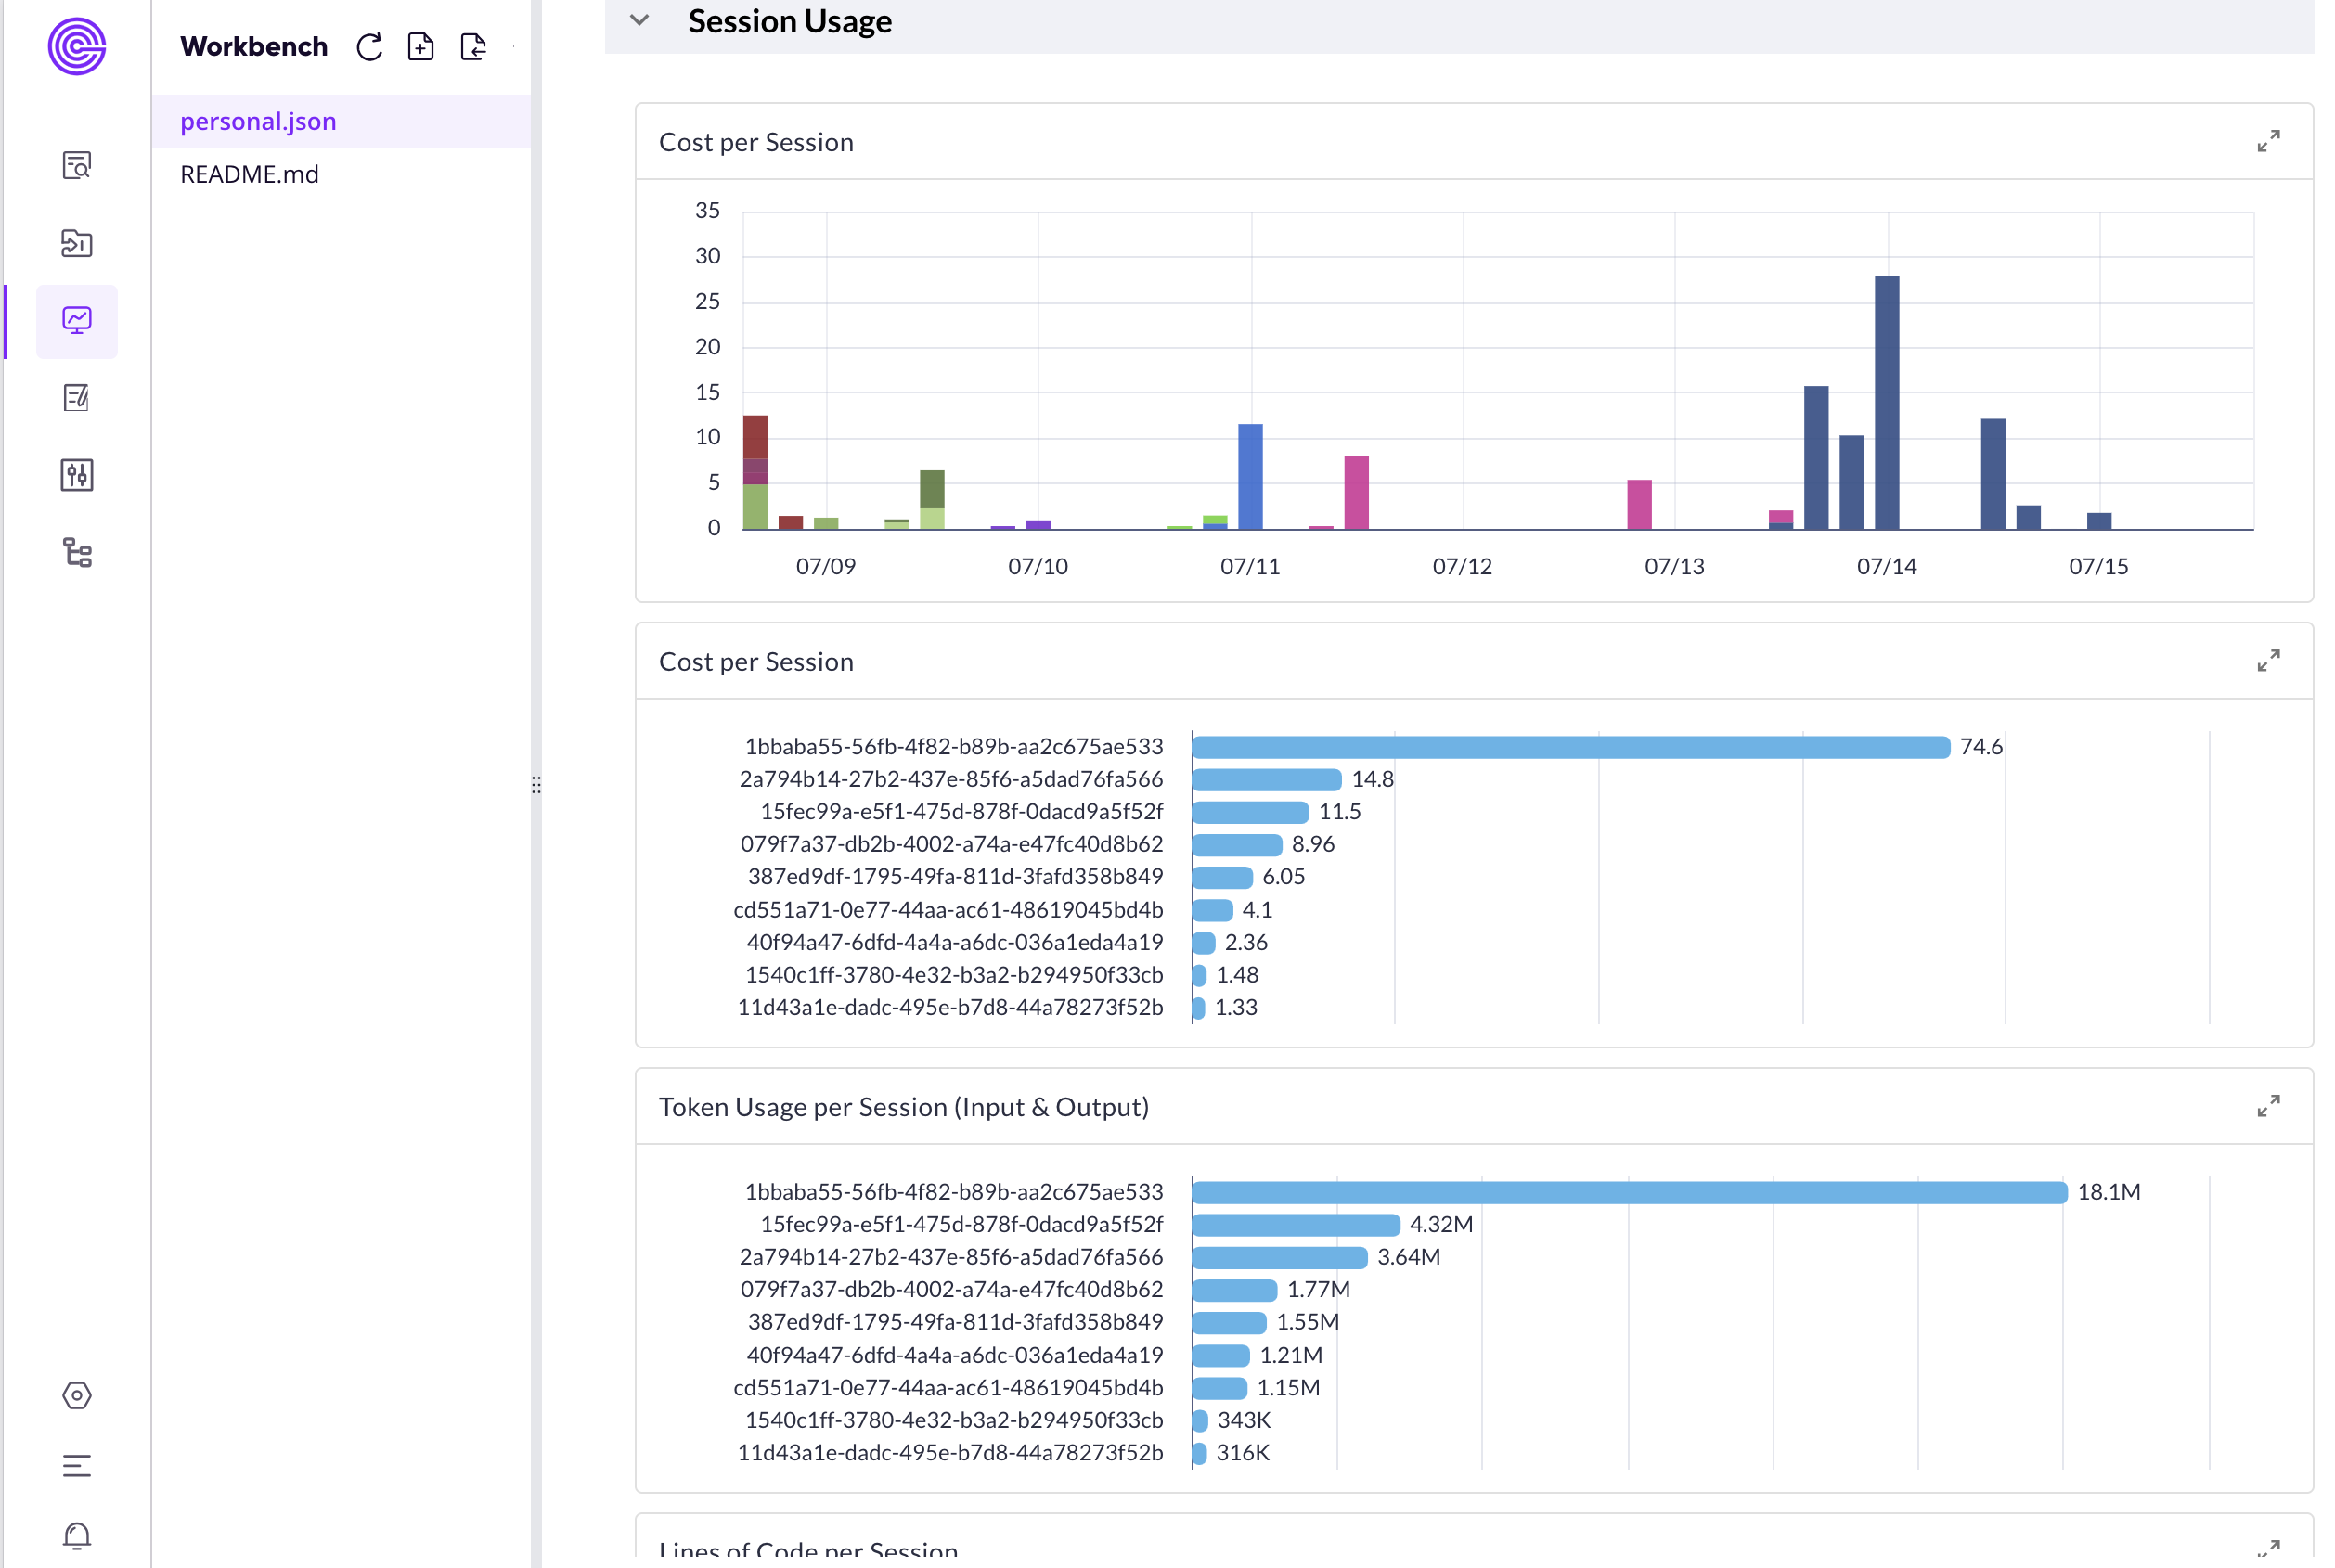
After all the setup and refinement, here is the dashboard I built. It gives me a comprehensive overview of my Claude Code usage, costs, and productivity at a glance.
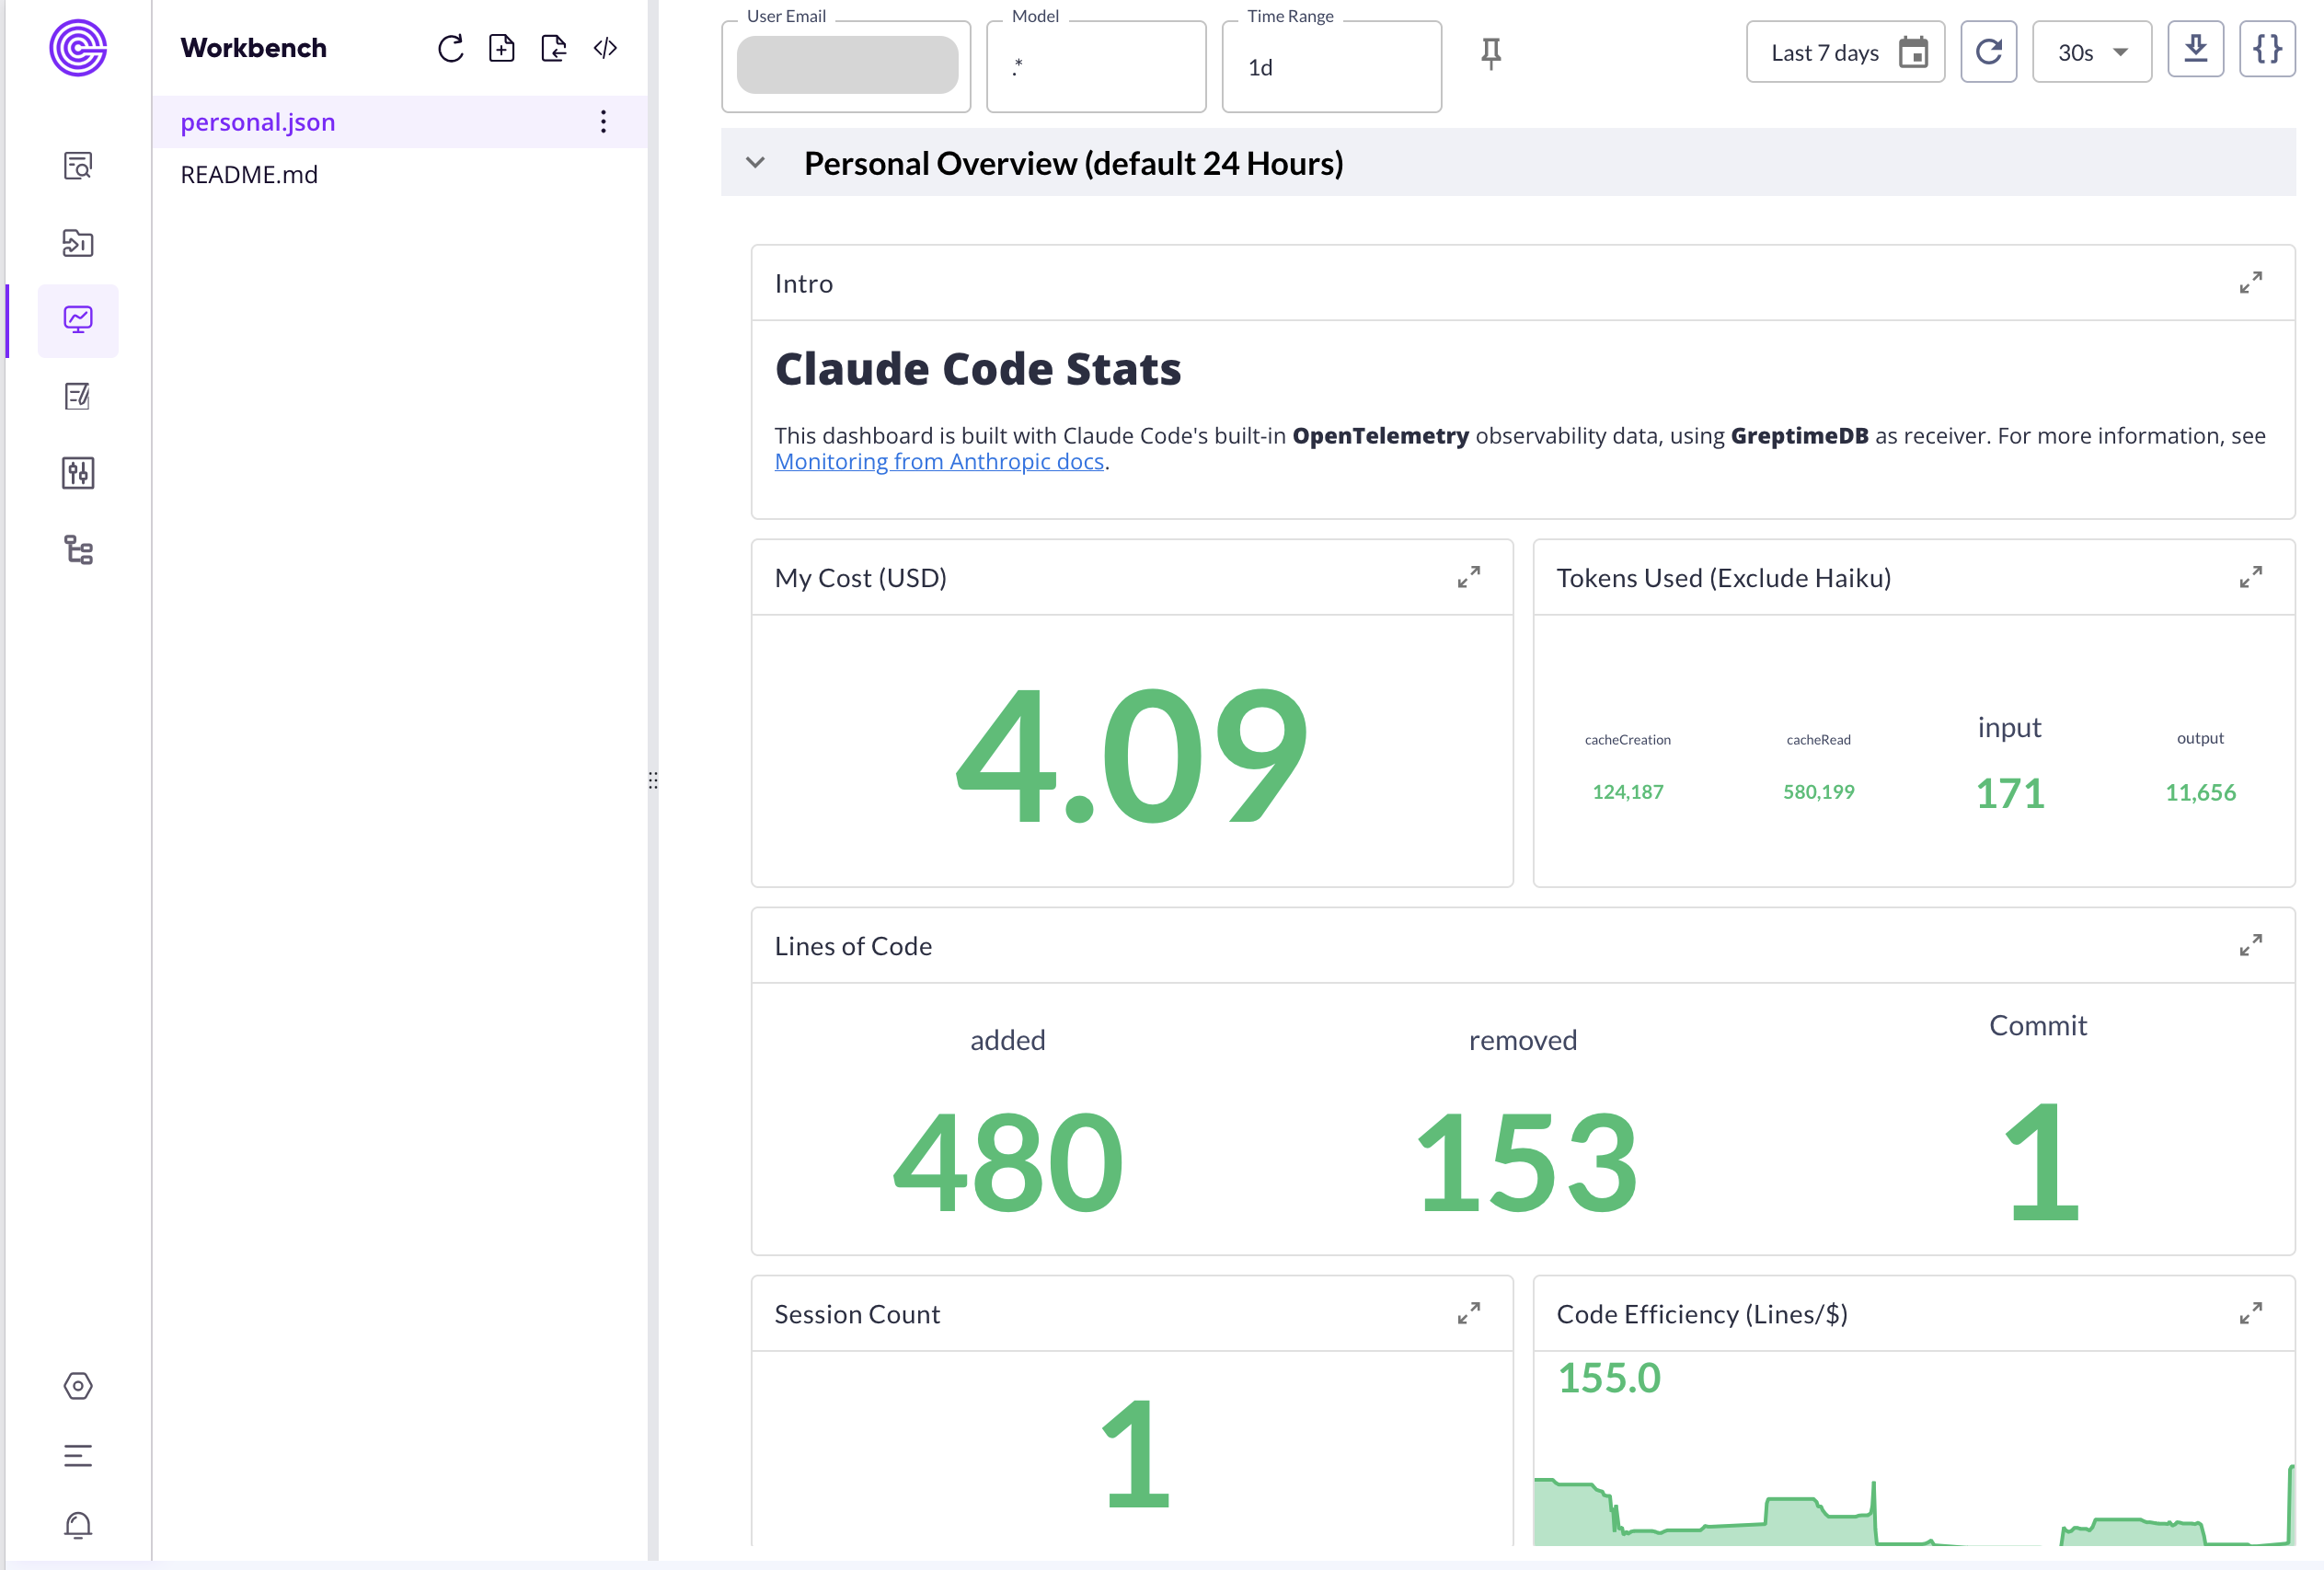
Because this is all "Dashboard as Code," I can easily share my setup with anyone who's interested. You can find the full Perses configuration for this dashboard right here.
Wrapping Up
This was a fun little weekend project that combined my love for data with my daily coding workflow. But beyond the technical setup, using this dashboard has revealed some genuinely interesting insights.
The OpenTelemetry data showed me something
ccusagecouldn't:Claude Codeuses theHaikumodel under the hood! By breaking down token usage by model, I could see that it intelligently offloads lighter, less complex tasks to Haiku. This is a fascinating glimpse into its operational efficiency that is otherwise invisible.A small feature request for the future. The session metric provides a session_id, which is great for counting active sessions. However, locally, I can see the session name (which I usually align with my project). It would be amazing if this session name could be added as a label to the telemetry data. This would allow for a much more powerful breakdown of usage by project or context.
The dashboard proved its worth in a very real way. The other day, I got into a "vibe coding" flow state, coding away for hours. Suddenly, I hit my usage limit and was locked out—I had even burned through my Sonnet allowance for the day. I was shocked. But a quick look at my dashboard told the story. In about two hours, I had consumed a massive 6 million tokens. The breakdown was wild: roughly 500 input tokens, only 50k output tokens, and the rest was all from the cache. The session was dominated by the Opus model (from my $100 plan). Without this data, I would have had no idea how I'd hit the limit so fast.
If you're a Claude Code user and a data geek like me, I highly recommend giving this a try. It's a fantastic way to get a deeper understanding of your own coding patterns, the tool's inner workings, and your efficiency. Happy coding, and happy collecting!

