On this page

With the release of GreptimeDB v0.15, our built-in Dashboard has received two exciting new features: Trace View and Log Ingestion. This article first introduces Trace View, followed by a detailed explanation of the Log Ingestion feature.
🔍 Trace View Introduction
Trace List Query
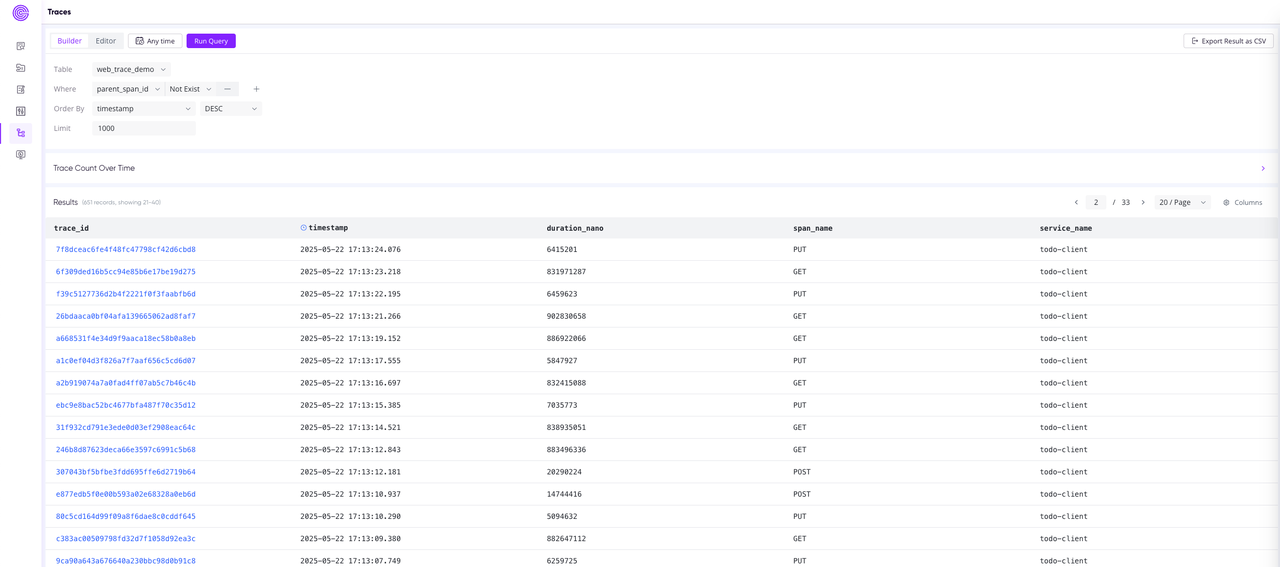
- Use the Builder to construct Trace queries: by default, it queries the list of root spans.
- Supports custom condition queries: you can either input conditions directly or quickly build queries based on the data in the table.
Trace Details Page
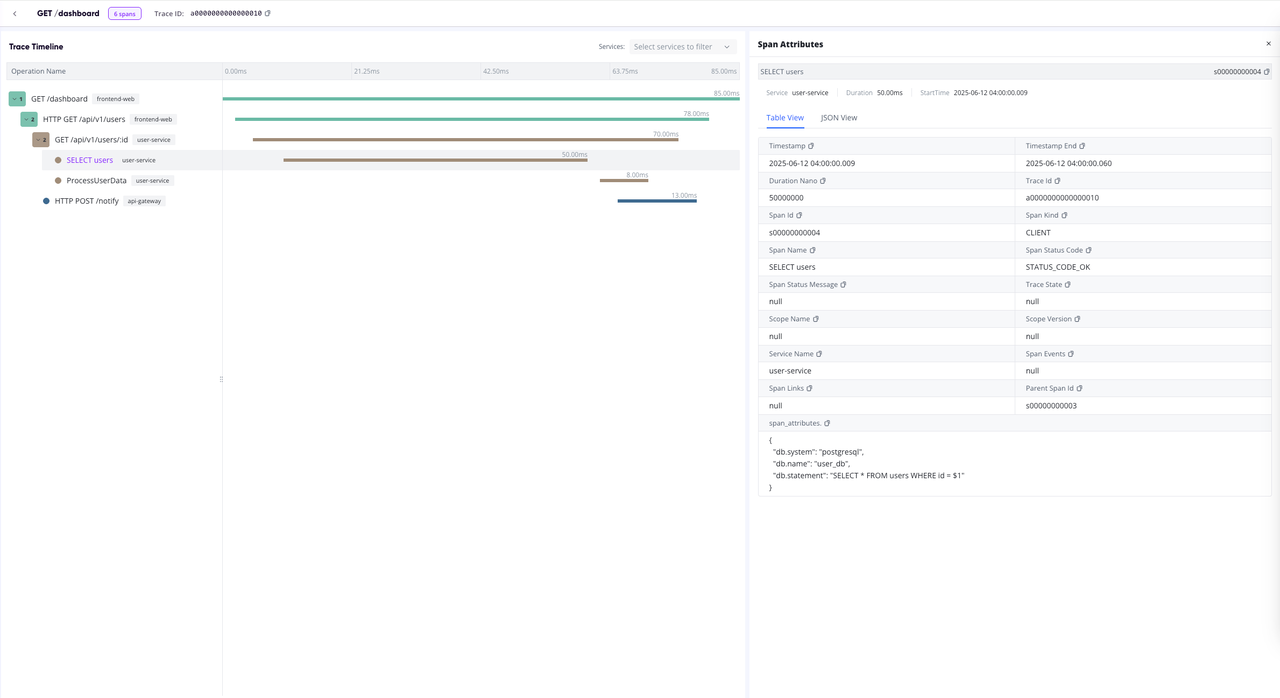
- Trace Timeline View: displays the structure of the entire trace, including key data such as span name and duration.
- Each span is a row in the view.
- By selecting a row, you can view the details of the current span.
📥 Log Ingestion Feature
Why Log Ingestion?
Log analysis is critical for system monitoring, troubleshooting, and performance optimization. However, traditional log management often presents several challenges:
- Logs are scattered across various systems, making centralized analysis difficult.
- Manual log imports and configuration processes are tedious.
- Dependence on third-party tools or complex self-built pipelines increases operational complexity.
Now, GreptimeDB v0.15 Dashboard now includes an integrated log ingestion feature, allowing users to quickly import, analyze, and centrally manage logs.
End-to-End Log Ingestion Flow from Pipeline Configuration
Before v0.15, the Dashboard already provided a comprehensive Pipeline Configuration page. Users could create pipeline files and test their configurations by uploading logs (see official documentation).
After creating and verifying a pipeline file, it is stored in the database, ready to be used directly in the newly introduced Log Ingestion page.
Step-by-Step Guide for Log Ingestion
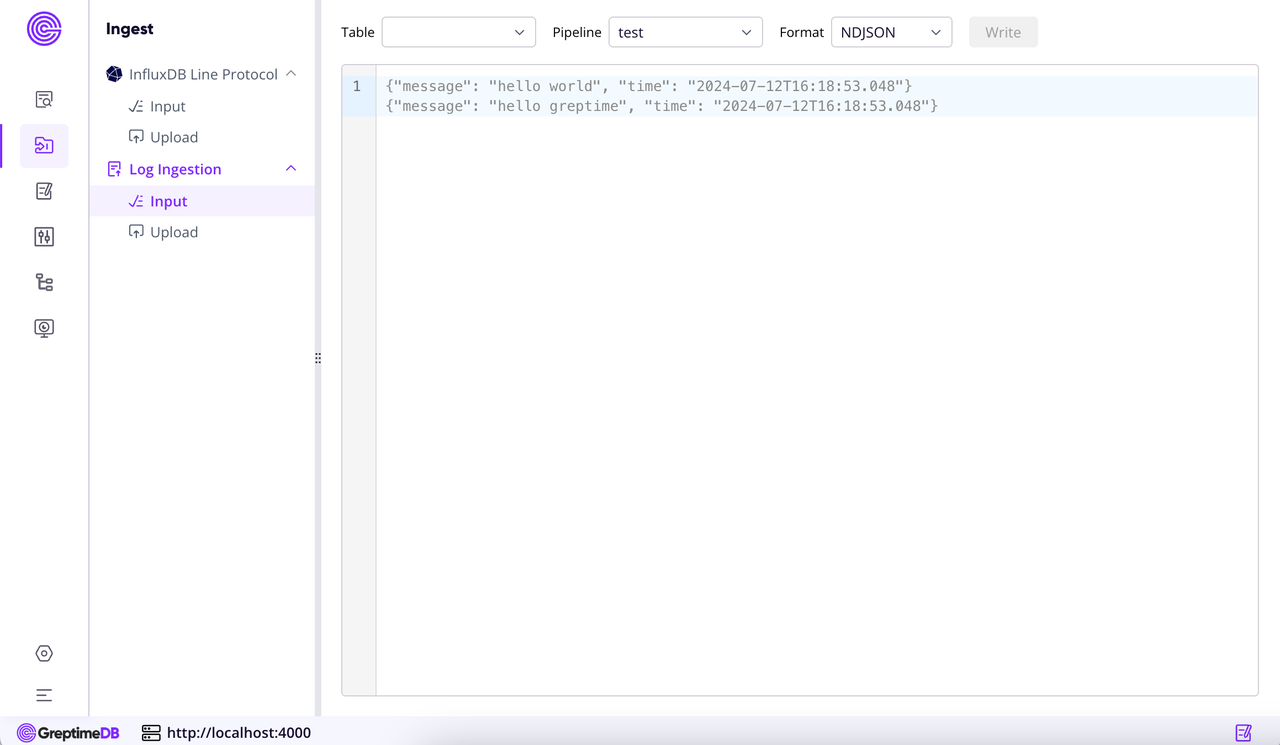
The new Log Ingestion submenu in the Dashboard simplifies the log import process into a few easy steps:
- Select an existing pipeline configuration file (previously created and stored via Pipeline Configuration).
- Specify the target table name for the logs.
- Choose the log format: NDJSON, JSON, or plain text.
- Paste logs directly (Input) or upload log files (Upload).
Here is an example screenshot of the Log Ingestion interface, showcasing pipeline selection, table naming, and log format choices:
Once these steps are completed, the Dashboard automatically processes and imports the logs.
Real-Time Log Analysis
After ingestion, you can immediately view and query your logs in the existing Log Query page within the Dashboard. No additional tools or environment switches are needed, simplifying log analysis significantly.
For further details on the log query page and useful tips, please refer to our previous article on Log View functionality.
🚩 Get Started Quickly
Upgrade to GreptimeDB v0.15 today to experience our new trace view and log ingestion feature, and don't hesitate to provide feedback to help us further improve!
🌱 Looking Ahead
Currently, the Ingest module in the Dashboard supports both InfluxDB Line Protocol and Log Ingestion. We also plan to add support for additional protocols and formats in future releases, making data ingestion even more versatile.