本页内容
近期,DeepSeek 大语言模型大放异彩,展现出强大的技术魅力,吸引了众多关注,甚至被誉为“国运级”的创新。在杭州这座充满创新活力的城市,Greptime 作为同样开源且深耕于技术领域的专业团队,亦期望向深度求索这样的团队取经,秉持开源、开放及专业的精神,为中国的基础软件事业贡献绵薄之力。
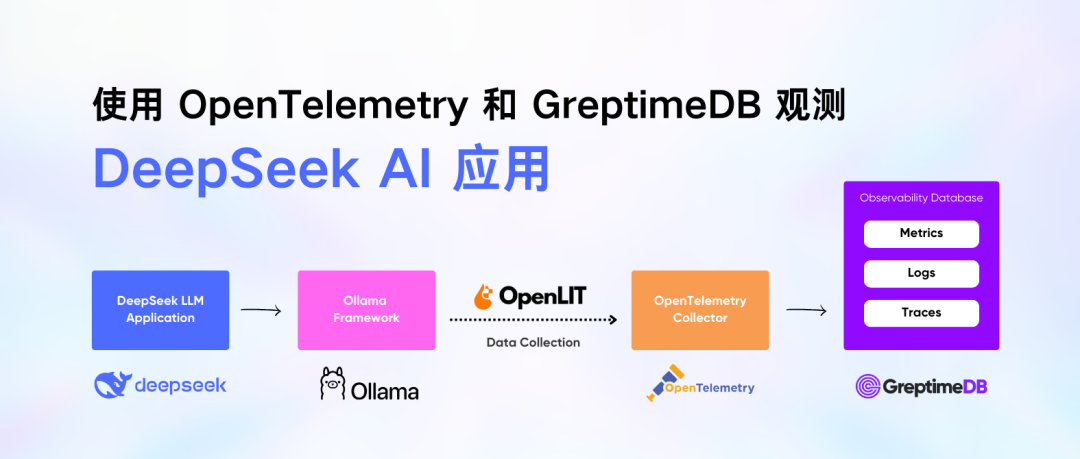
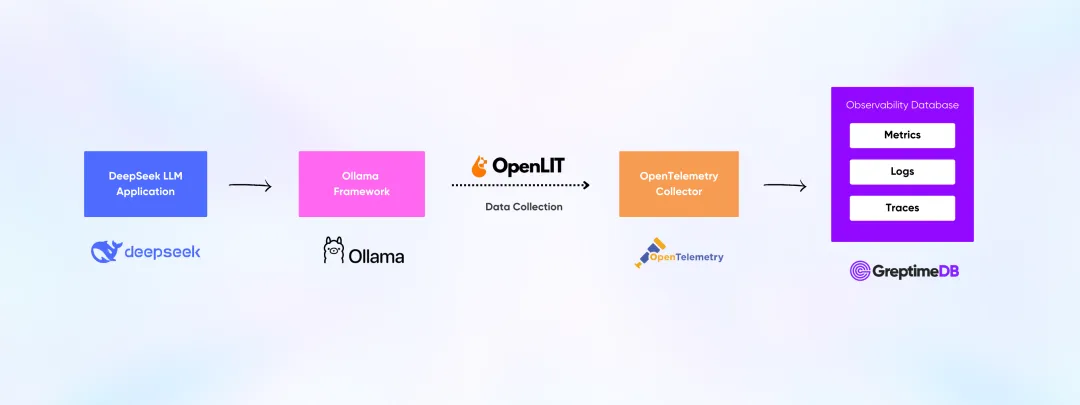
GreptimeDB 作为一个统一的可观测性数据库,完整支持 OpenTelemetry 数据协议的写入,能够作为 Otel Collector 的 Backend,同时保存指标(Metric)、链路跟踪(Trace)和日志(Log)等不同的数据格式。
Ollama 是一个轻量级的本地大语言模型运行框架,能够便捷地部署和运行各类 LLM 应用。在 LLM 应用的运维过程中,有效的监控对于保障服务的稳定性和可靠性至关重要。本文将通过一个具体实例,详细介绍如何利用 GreptimeDB 和 OpenTelemetry 来实现对基于Ollama部署的 DeepSeek LLM 应用的全方位监控。
安装与运行 Ollama 及 DeepSeek R1 模型
我们可在 Ollama 官方网站下载对应操作系统版本的安装包。在 Mac 系统上,能简便地借助 Homebrew 来达成:
bash
brew install ollama开启终端,接着确认下 ollma 是否已正确安装:
bash
ollama --version笔者所安装的版本为 0.5.7 :
plain
ollama version is 0.5.7运行 ollma 可执行:
bash
ollama serve而后,我们需拉取并尝试运行 DeepSeek 模型,鉴于笔者使用的是一款老式的 Macbook Pro,此文以 DeepSeek R1 1.5b 为例:
bash
ollama run deepseek-r1:1.5b倘若网络正常,并成功下载 DeepSeek 模型后,将会进入 Ollama 与 LLM 的交互界面:
bash
$ ollama run deepseek-r1:1.5b
>>> /?
Available Commands:
  /set            Set session variables
  /show           Show model information
  /load <model>   Load a session or model
  /save <model>   Save your current session
  /clear          Clear session context
  /bye            Exit
  /?, /help       Help for a command
  /? shortcuts    Help for keyboard shortcuts

Use """ to begin a multi-line message.
出现如上信息表明我们已成功完成 Ollama 框架与 DeepSeek R1 1.5b 模型的正确配置。
现在,我们尝试向 DeepSeek 提出一个问题:
bash
curl http://localhost:11434/api/chat -d '{
  "model": "deepseek-r1:1.5b",
  "messages": [
    {
      "role": "user",
      "content": "why is the sky blue?"
    }
    ],
   "stream": false
}'
DeepSeek 会返回生成的答案。
接下来我们需要配置 GreptimeDB 与 OpenTelemetry Collector。
配置 GreptimeDB 和 Otel Collector
我们使用 Docker Compose 来配置和启动 GreptimeDB 和 OpenTelemetry Collector,编写 docker-compose.yml:
yaml
services:
  greptimedb:
    image: docker.io/greptime/greptimedb:v0.11.2
    command: standalone start --http-addr=0.0.0.0:4000 --rpc-addr=0.0.0.0:4001 --mysql-addr=0.0.0.0:4002 --postgres-addr 0.0.0.0:4003
    ports:
      - 4000:4000
      - 4001:4001
      - 4002:4002
      - 4003:4003
    networks:
      - demo-network
    healthcheck:
      test: [ "CMD", "curl", "-f", "http://127.0.0.1:4000/health" ]
      interval: 3s
      timeout: 3s
      retries: 5

  otel-collector:
    image: otel/opentelemetry-collector-contrib
    volumes:
      - ./otel-collector-config.yaml:/etc/otelcol-contrib/config.yaml
    ports:
      - 13133:13133 # health_check extension
      - 4317:4317 # OTLP gRPC receiver
      - 4318:4318 # OTLP http receiver
    networks:
      - demo-network

networks:
  demo-network:
我们在同样的目录下创建 Otel Collector 的配置文件 otel-collector-config.yaml:
yaml
receivers:
  otlp:
    protocols:
      grpc:
        endpoint: 0.0.0.0:4317
      http:
        endpoint: 0.0.0.0:4318

exporters:
  debug:
    verbosity: detailed
  otlp:
    endpoint: localhost:4317
    tls:
      insecure: true
  otlphttp:
    endpoint: http://greptimedb:4000/v1/otlp
    tls:
      insecure: true

extensions:
  health_check:

service:
  extensions: [health_check]
  pipelines:
    traces:
      receivers: [otlp]
      exporters: [debug,otlphttp]
    metrics:
      receivers: [otlp]
      exporters: [debug,otlphttp]
    logs:
      receivers: [otlp]
      exporters: [debug,otlphttp]
我们将 Otel Collector 采集到的 Metrics, Traces 和 Logs 都导出到后端 otlphttp,它被配置为 GreptimeDB 的 API 接口。
关于 GreptimeDB 对于 OpenTelemetry 协议的支持请阅读文档。
启动 GreptimeDB 和 Otel Collector
接下来我们就可以通过 Docker Compose 来启动 GreptimeDB 和 Otel Collector 了:
bash
docker-compose up如果一切正常,你应该可以看到启动日志:
sql
WARN[0000] Found orphan containers ([flownode0 frontend0 datanode0 metasrv etcd0]) for this project. If you removed or renamed this service in your compose file, you can run this command with the --remove-orphans flag to clean it up.
[+] Running 2/0
 ✔ Container tmp-otel-collector-1  Created                                                                                                                                                                       0.0s
 ✔ Container tmp-greptimedb-1      Created
 ...
 ...
 greptimedb-1      | 2025-02-10T07:44:07.951605Z  INFO servers::grpc: gRPC server is bound to 0.0.0.0:4001
greptimedb-1      | 2025-02-10T07:44:07.953823Z  INFO servers::server: Service GRPC_SERVER is started at 0.0.0.0:4001
greptimedb-1      | 2025-02-10T07:44:07.953881Z  INFO servers::server: MySQL server started at 0.0.0.0:4002
greptimedb-1      | 2025-02-10T07:44:07.953885Z  INFO servers::server: Service MYSQL_SERVER is started at 0.0.0.0:4002
greptimedb-1      | 2025-02-10T07:44:07.953906Z  INFO servers::server: Postgres server started at 0.0.0.0:4003
greptimedb-1      | 2025-02-10T07:44:07.953925Z  INFO servers::server: Service POSTGRES_SERVER is started at 0.0.0.0:4003
greptimedb-1      | 2025-02-10T07:44:07.953960Z  INFO servers::http: Enable dashboard service at '/dashboard'
greptimedb-1      | 2025-02-10T07:44:07.954086Z  INFO servers::http: HTTP server is bound to 0.0.0.0:4000
greptimedb-1      | 2025-02-10T07:44:07.954113Z  INFO servers::server: Service HTTP_SERVER is started at 0.0.0.0:4000
greptimedb-1      | 2025-02-10T07:44:07.954169Z  INFO flow::adapter: Starting flownode manager's background task
...
...
otel-collector-1  | 2025-02-10T07:44:07.979Z        info        otlpreceiver@v0.119.0/otlp.go:112        Starting GRPC server        {"kind": "receiver", "name": "otlp", "data_type": "traces", "endpoint": "0.0.0.0:4317"}
otel-collector-1  | 2025-02-10T07:44:07.980Z        info        otlpreceiver@v0.119.0/otlp.go:169        Starting HTTP server        {"kind": "receiver", "name": "otlp", "data_type": "traces", "endpoint": "0.0.0.0:4318"}
otel-collector-1  | 2025-02-10T07:44:07.980Z        info        healthcheck/handler.go:132        Health Check state change        {"kind": "extension", "name": "health_check", "status": "ready"}
otel-collector-1  | 2025-02-10T07:44:07.980Z        info        service@v0.119.0/service.go:275        Everything is ready. Begin running and processing data.
可以尝试打开 GreptimeDB 的 dashboard 验证。
使用 OpenLIT 观测 Ollama 应用
OpenLIT 是一个开源的 AI 工程平台,它提供了一套完整的 LLM 可观测性、GPU 监控、评估和提示管理解决方案。它的 SDK 可以利用 OpenTelemetry 的自动检测(Auto-Instrumentation)功能来监控基于 Ollama 模型构建的 LLM 应用程序,提供性能追踪、 Token 使用情况和用户交互等监控能力。
安装需要的 Python 依赖库:
bash
pip install ollama --quiet
pip install langchain --quiet
pip install langchain-ollama --quiet
pip install openlit --quiet
在你的 AI 应用里初始化 OpenLIT,将采集到的数据写到 otel-collector 的 4318 端口:
python
import openlit

openlit.init(otlp_endpoint="http://127.0.0.1:4318", disable_batch=True)
我们跑个最简单的应用,比如让 DeepSeek 讲个笑话,保存下列内容为 joke.py:
python
import openlit

from langchain_ollama.llms import OllamaLLM

openlit.init(otlp_endpoint="http://127.0.0.1:4318", disable_batch=True)

llm = OllamaLLM(model='deepseek-r1:1.5b')

print(llm.invoke("Tell me a joke"))
简单执行这个脚本:
bash
python joke.py输出:
bash
<think>

</think>

Sure! Here's a light one:

Why don’t skeletons fight each other?
Because they have Genders.
这个笑话不错!
如果一切正常, Otel collector 已经将链路跟踪和指标数据写入到 GreptimeDB,我们可以查看 GreptimeDB 的表,通过 MySQL 客户端连接 4000 端口:
bash
mysql -h 0.0.0.0 -P 4002执行 show tables:
sql
mysql> show tables;
+----------------------------+
| Tables                     |
+----------------------------+
| gen_ai_total_requests      |
| gen_ai_usage_cost_bucket   |
| gen_ai_usage_cost_count    |
| gen_ai_usage_cost_sum      |
| gen_ai_usage_input_tokens  |
| gen_ai_usage_output_tokens |
| gen_ai_usage_total_tokens  |
| numbers                    |
| opentelemetry_traces       |
+----------------------------+
9 rows in set (0.01 sec)
其中 opentelemetry_traces 保存了链路跟踪数据,其他 gen_ai 开头的都是 OpenLIT 采集的指标数据。
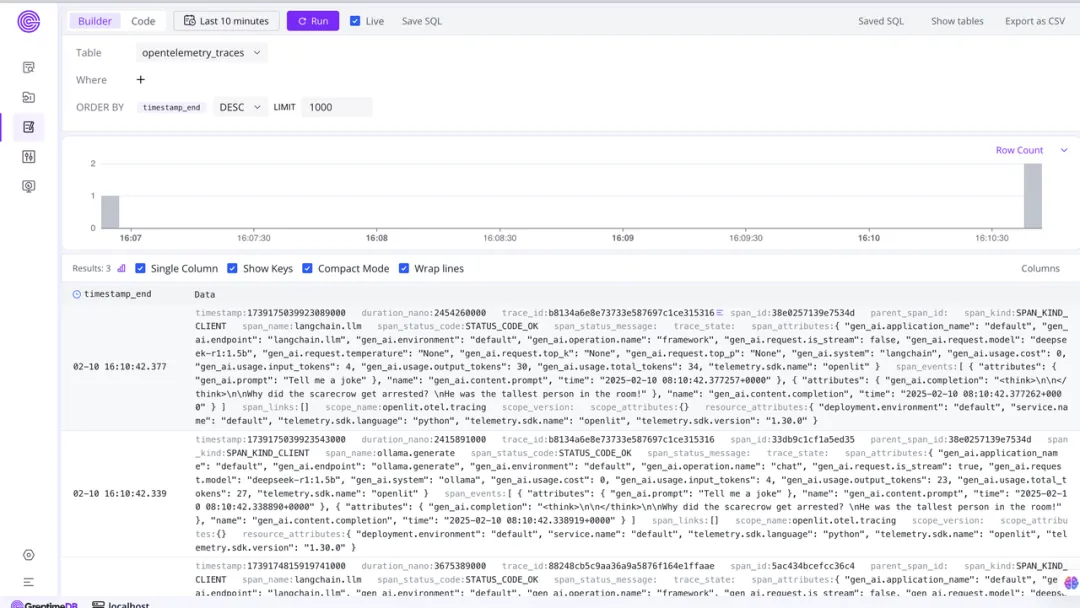
使用 GreptimeDB Dashboard 进行数据可视化
我们可以打开 GreptimeDB Dashboard 的日志视图,查看链路数据。
还可以通过 SQL 查看总请求数:
sql
select * from gen_ai_total_requests;输出类似:
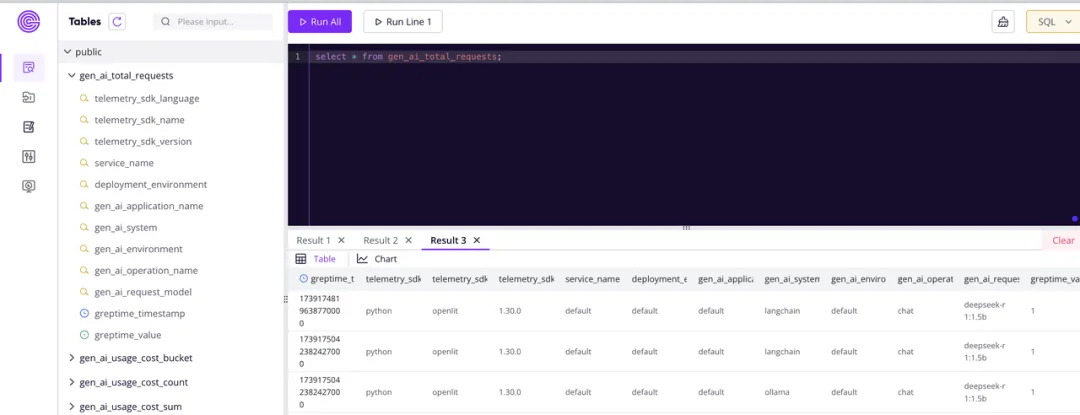
最后,我们还可以结合 Grafana 来展现这些指标和链路数据。GreptimeDB 支持 Grafana 的 MySQL 和 Prometheus 数据源,并且提供了自己的数据源插件,欢迎阅读文档。
本文的源码可以在这里找到。
关于 Greptime
Greptime 格睿科技专注于为可观测、物联网及车联网等领域提供实时、高效的数据存储和分析服务,帮助客户挖掘数据的深层价值。目前基于云原生的时序数据库 GreptimeDB 已经衍生出多款适合不同用户的解决方案,更多信息或 demo 展示请联系下方小助手(微信号:greptime)。
欢迎对开源感兴趣的朋友们参与贡献和讨论,从带有 good first issue 标签的 issue 开始你的开源之旅吧~期待在开源社群里遇见你!添加小助手微信即可加入“技术交流群”与志同道合的朋友们面对面交流哦~
Star us on GitHub Now: https://github.com/GreptimeTeam/greptimedb
Twitter: https://twitter.com/Greptime
Slack: https://greptime.com/slack


