本页内容
GreptimeDB has now been updated to v0.16—we encourage all users to upgrade for the latest features and enhancements. This post introduces the v0.15 pipeline capabilities, which remain fully applicable in v0.16.
Overview
In v0.15, GreptimeDB delivered major improvements and a comprehensive enhancement of the Pipeline Engine, dramatically increasing the flexibility and extensibility of data preprocessing. One of the most notable highlights is the native pipeline support for both Prometheus Remote Write and Loki Push API.
Now, you can seamlessly route data from these protocols into customizable pipeline workflows by simply setting the x-greptime-pipeline-name HTTP header in your requests.
Prometheus Remote Write + Pipeline: A Practical Example
Let's start with a simple example demonstrating how GreptimeDB's pipeline integrates with Prometheus Remote Write.
Here's a sample docker-compose and Prometheus configuration:
yaml
---
version: '3.8'
services:
  node_exporter:
    image: quay.io/prometheus/node-exporter:latest
    container_name: node_exporter
    command:
      - '--path.rootfs=/host'
    volumes:
      - '/:/host:ro,rslave'
    networks:
      - monitoring

  prometheus:
    image: prom/prometheus:latest
    volumes:
      - ./prometheus.yml:/etc/prometheus/prometheus.yml
    ports:
      - 9090:9090
    depends_on:
      - node_exporter
    networks:
      - monitoring

networks:
  monitoring:
global:
  scrape_interval: 15s
  evaluation_interval: 15s

scrape_configs:
  - job_name: 'node-exporter'
    static_configs:
      - targets: ['node_exporter:9100']

remote_write:
  - url: 'http://host.docker.internal:4000/v1/prometheus/write'
This setup launches a local node_exporter to collect host metrics. Prometheus scrapes these metrics and writes them to a local GreptimeDB instance via Remote Write.
Starting Up & Verifying the Pipeline
First, start GreptimeDB with ./greptime standalone start in standalone mode. Then launch node_exporter and Prometheus using docker compose up. After startup, GreptimeDB logs table creation events. Use a MySQL client to connect to GreptimeDB and verify that the metrics tables are being created and populated:
plain
mysql> show tables;
+---------------------------------------------+
| Tables                                      |
+---------------------------------------------+
| go_gc_duration_seconds                      |
| go_gc_duration_seconds_count                |
| go_gc_duration_seconds_sum                  |
| go_gc_gogc_percent                          |
| go_gc_gomemlimit_bytes                      |
| go_goroutines                               |
| go_info                                     |
| go_memstats_alloc_bytes                     |
| go_memstats_alloc_bytes_total               |
| go_memstats_buck_hash_sys_bytes             |
| go_memstats_frees_total                     |
| go_memstats_gc_sys_bytes                    |
| go_memstats_heap_alloc_bytes                |
| go_memstats_heap_idle_bytes                 |
| go_memstats_heap_inuse_bytes                |
| go_memstats_heap_objects                    |
| go_memstats_heap_released_bytes             |
| go_memstats_heap_sys_bytes                  |
| go_memstats_last_gc_time_seconds            |
| go_memstats_mallocs_total                   |
| go_memstats_mcache_inuse_bytes              |
... ignore
Select one table randomly and proceed to query it, the results are as follows:
Note: The specific fields will vary depending on the platform and settings used by
node_exporter.
plain
mysql> select * from `go_memstats_mcache_inuse_bytes`;
+----------------------------+----------------+--------------------+---------------+
| greptime_timestamp         | greptime_value | instance           | job           |
+----------------------------+----------------+--------------------+---------------+
| 2025-07-11 07:28:28.346000 |           1200 | node_exporter:9100 | node-exporter |
| 2025-07-11 07:28:43.346000 |           1200 | node_exporter:9100 | node-exporter |
| 2025-07-11 07:28:58.346000 |           1200 | node_exporter:9100 | node-exporter |
| 2025-07-11 07:29:13.346000 |           1200 | node_exporter:9100 | node-exporter |
| 2025-07-11 07:29:28.346000 |           1200 | node_exporter:9100 | node-exporter |
| 2025-07-11 07:29:43.350000 |           1200 | node_exporter:9100 | node-exporter |
| 2025-07-11 07:29:58.346000 |           1200 | node_exporter:9100 | node-exporter |
| 2025-07-11 07:30:13.349000 |           1200 | node_exporter:9100 | node-exporter |
+----------------------------+----------------+--------------------+---------------+
8 rows in set (0.06 sec)
Enriching Metrics with a Custom source Field Using Pipelines
Suppose you want every metrics entry to include a custom source field. First, create a Pipeline configuration like this:
yaml
version: 2
processors:
  - VRL:
      source: |
        .source = "local_laptop"
        .

transform:
  - field: greptime_timestamp
    type: time, ms
    index: timestamp
The VRL processor adds a
sourcefield with value"local_laptop"to each record.Pipeline Version 2 allows you to define transformation logic only for specific columns (like timestamps), with other columns inferred automatically.
Deploying the Pipeline
First, clear GreptimeDB's data files by running rm -rf greptimedb_data/, and then start GreptimeDB in standalone mode. Next, use the command curl -X "POST" "http://localhost:4000/v1/events/pipelines/pp" -F "file=@pipeline.yaml" to upload the pipeline configuration to GreptimeDB and ensure it is successfully applied. After confirming the pipeline is in place, update your Prometheus configuration to include the x-greptime-pipeline-name HTTP header as shown below:
yaml
global:
  scrape_interval: 15s
  evaluation_interval: 15s

scrape_configs:
  - job_name: 'node-exporter'
    static_configs:
      - targets: ['node_exporter:9100']  # Replace with the actual IP/hostname of the node exporter

remote_write:
  - url: 'http://host.docker.internal:4000/v1/prometheus/write'
    headers:
      x-greptime-pipeline-name: "pp"
Start the components using docker compose up. Once you see the relevant log outputs, connect to GreptimeDB with a MySQL client and query the previously created tables:
plain
mysql> select * from `go_memstats_mcache_inuse_bytes`;
+----------------------------+----------------+--------------------+---------------+--------------+
| greptime_timestamp         | greptime_value | instance           | job           | source       |
+----------------------------+----------------+--------------------+---------------+--------------+
| 2025-07-11 07:42:03.064000 |           1200 | node_exporter:9100 | node-exporter | local_laptop |
| 2025-07-11 07:42:18.069000 |           1200 | node_exporter:9100 | node-exporter | local_laptop |
+----------------------------+----------------+--------------------+---------------+--------------+
2 rows in set (0.01 sec)
You'll see the source column populated as configured and the value is local_laptop as set in Pipeline.
The Pipeline Engine empowers dynamic, fine-grained transformations on metrics as they are ingested—boosting both processing capability and efficiency.
Loki Push API + Pipeline Example: Log Ingestion
v0.15 also brings pipeline support for the Loki Push API. Similarly, by setting x-greptime-pipeline-name in the header, logs enter the pipeline workflow.
Here's a typical scenario using Grafana Alloy to collect Docker logs:
docker-compose.yml:
yaml
version: '3'
services:
  alloy:
   image: grafana/alloy:latest
   ports:
     - 12345:12345
     - 4317:4317
     - 4318:4318
   volumes:
     - ./config.alloy:/etc/alloy/config.alloy
     - /var/run/docker.sock:/var/run/docker.sock
command: run --server.http.listen-addr=0.0.0.0:12345 --storage.path=/var/lib/alloy/data /etc/alloy/config.alloyconfig.alloy:
plain
// Discovery, relabel, collect, and forward logs with Alloy & Loki.
discovery.docker "linux" { host = "unix:///var/run/docker.sock" }
discovery.relabel "logs_integrations_docker" {
  targets = []
  rule {
      source_labels = ["__meta_docker_container_name"]
      regex = "/(.*)"
      target_label = "service_name"
  }
}
loki.source.docker "default" {
  host       = "unix:///var/run/docker.sock"
  targets    = discovery.docker.linux.targets
  labels     = {"platform" = "docker"}
  relabel_rules = discovery.relabel.logs_integrations_docker.rules
  forward_to = [loki.write.local.receiver]
}
loki.write "local" {
  endpoint {
    url = "http://host.docker.internal:4000/v1/loki/api/v1/push"
    headers = {
      "x-greptime-pipeline-name" = "greptime_identity",
    }
  }
}
This setup attaches a platform and a service_name label to each log, streams them to GreptimeDB via the Loki API, and indicates the pipeline with the header.
Launch GreptimeDB and Alloy, then open the GreptimeDB Dashboard's Logview to browse ingested data:
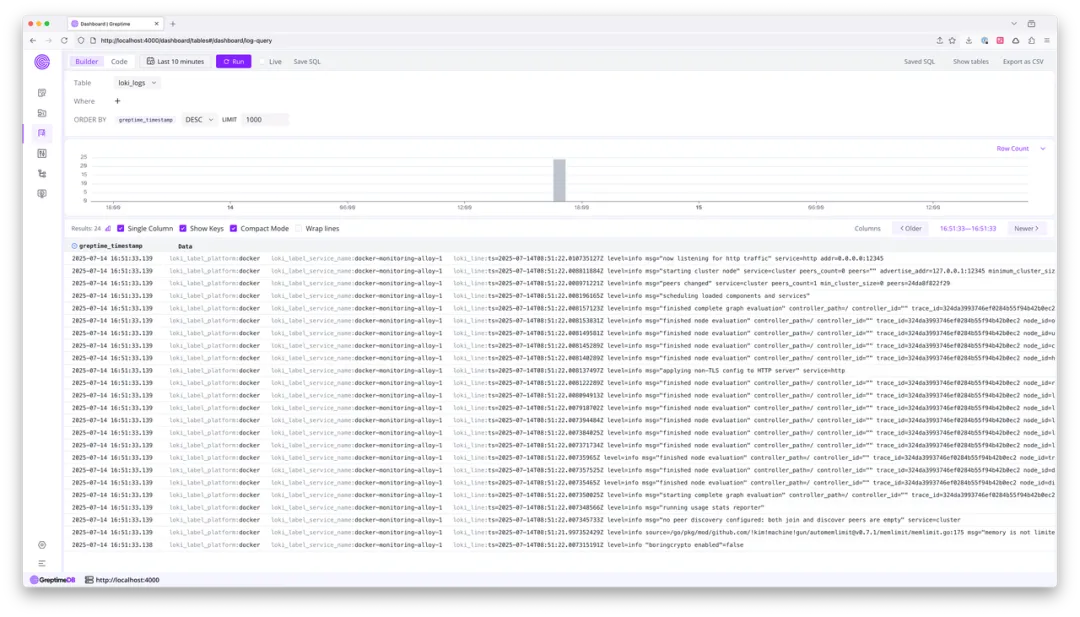
Note: you can open local dashboard using the built-in dashboard.
Notice that the loki_label_service_name field contains a "docker-monitoring-" prefix. Let's see how to remove this prefix with a pipeline:
yaml
# pipeline.yaml
version: 2
processors:
  - VRL:
      source: |
        if exists(.loki_label_service_name) {
          .loki_label_service_name, err = replace(.loki_label_service_name, "docker-monitoring-", "")
        }
        .

transform:
  - fields:
      - greptime_timestamp
    type: time
    index: timestamp
The VRL script checks for loki_label_service_name, then removes the "docker-monitoring-" prefix if present.
After clearing any previous data, redeploy the pipeline under a new name (e.g., pp) and restart Alloy with the corresponding header updated.
After logs are ingested, the prefix is gone:
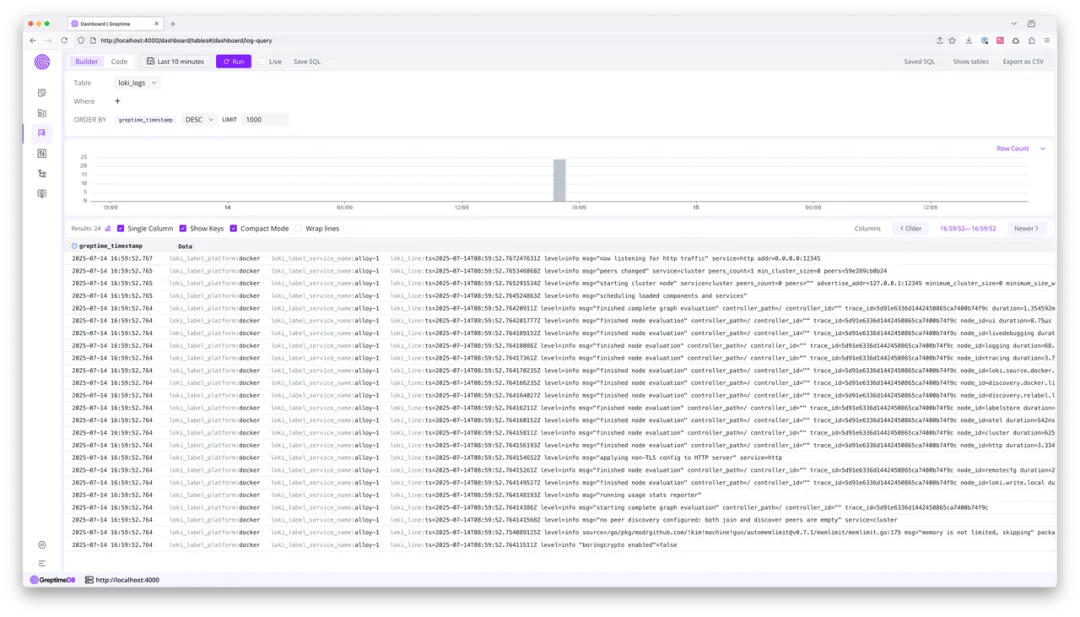
For more context on the Docker example, see here.
Auto-transform and Pipeline Version 2
Originally, pipelines required users to manually specify every field for persistence in the transform section. As data schemas grew more complex, this became unwieldy.
v0.15 introduces:
- Auto-transform: You can now omit
transform. The pipeline engine infers and persists field types automatically (as in thegreptime_identity).
Note: This does not apply when type casting or indexing is needed.
- Pipeline Version 2: Combines manual field transformation with auto-inference, letting you only configure fields to be noticed (like indexes and datatype conversion). All other fields are permitted by automatic inference.
Note: You must specify the timestamp index manually; other fields are handled automatically, dramatically simplifying pipeline authoring.
More details please refer to docs.
The Power of the VRL Processor
Pipelines get their flexibility from built-in processors. As use cases become more complex, previous processors are limited in flexibility.
GreptimeDB v0.15 introduces the VRL (Vector Remap Language) processor, a domain-specific language by Vector for advanced data transformation—especially observability data.
With VRL, you can script powerful logic for:
Field addition and modification
Conditional branching and error handling
Data conversions and complex calculations
In the above examples, we performed field enrichment and value modification, but VRL supports much richer transformations. The engine is optimized for VRL's data types, minimizing performance overhead during heavy data processing. The Dryrun API allows fast validation and iteration of transformation scripts.
Table Hints in Pipelines
When tables are auto-created by pipelines, it's not feasible to directly specify table options (like ttl, skip_wal, etc.) in the pipeline configuration. This poses challenges for bulk metrics ingestion.
Two traditional workarounds exist:
Manual Table Creation: Allows precise configuration but is impractical for hundreds or thousands of tables.
HTTP Header Table Options: Allows batch option injection but lacks per-table granularity.
v0.15 solves this with table hint variables in the pipeline context. Set specially-named variables in your pipeline logic (e.g., with VRL), and GreptimeDB injects them into the CREATE TABLE statement:
yaml
processors:
  - VRL:
      source: |
        .greptime_table_ttl = "15d"
        .greptime_table_suffix, err = "_" + .id
        .
You can even derive these options dynamically from incoming data.
Options apply only at table creation. For the complete list of variables, refer to the docs.
Conclusion
The Pipeline Engine upgrades in GreptimeDB v0.15 (and improved further in v0.16) vastly strengthen the database's capabilities for data preprocessing and schema management. We're continuing to expand pipeline support for new ingestion sources and to fine-tune performance and usability.
We invite you to explore these features in your workflow and share your feedback with the GreptimeDB community!

