本页内容
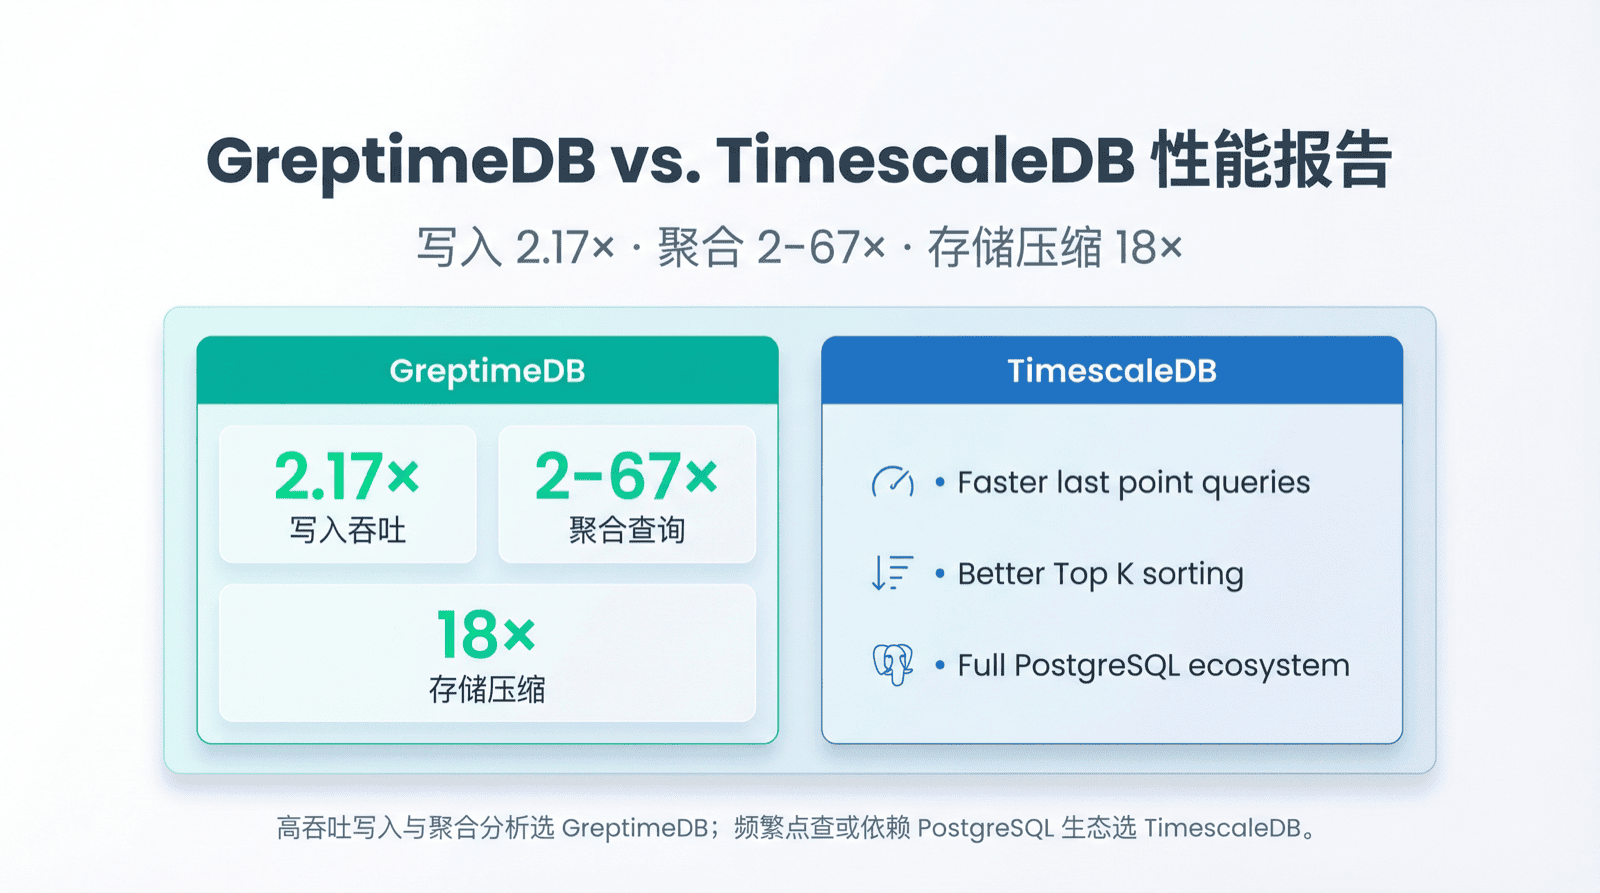
写入 2.17x,查询最快 67x,存储仅 1/18——TSBS 标准测试中,GreptimeDB 展现显著性能优势。
TimescaleDB 是目前最流行的时序数据库之一,基于 PostgreSQL 构建,生态成熟。GreptimeDB 是新一代云原生可观测性数据库,用 Rust 编写,专为高吞吐低延迟设计。两者代表了时序数据库的两种路线:一个在成熟关系数据库上扩展时序能力,另一个从零构建原生时序引擎。
本文分享基于 TSBS 的对比结果:写入、查询、存储的具体差异,差异背后的技术原因,以及完整复现步骤。
结论
- 写入吞吐:GreptimeDB 是 TimescaleDB 的 2.17 倍(285,301 vs 131,531 rows/sec)
- 查询性能:15 类查询中 GreptimeDB 赢了 13 类,最快达 67 倍
- 存储效率:GreptimeDB 占用空间仅 1/18(1.1 GB vs 20 GB)
- TimescaleDB 胜出场景:
lastpoint和groupby-orderby-limit查询
测试环境
| 项目 | 配置 |
|---|---|
| 实例规格 | AWS c5d.2xlarge(8 核,16 GB 内存) |
| 操作系统 | Ubuntu 24.04 LTS |
| 存储 | 300 GB gp3 SSD |
| GreptimeDB | v1.0.0-beta.2 |
| TimescaleDB | 2-postgresql-17 |
测试使用 TSBS(Time Series Benchmark Suite),由 TimescaleDB 团队开发的业界标准测试套件。我们使用 GreptimeDB 维护的 fork,增加了 GreptimeDB 支持。
TSBS 保证公平性:数据和查询预先生成,使用相同伪随机种子,每个数据库加载完全相同的数据、执行完全相同的查询。
测试数据集
采用 cpu-only 场景,模拟 4000 台服务器 3 天的 CPU 监控数据:
- Scale:4000 台主机
- 时间范围:2023-06-11 至 2023-06-14(3 天)
- 采集间隔:10 秒
- 总数据量:1.036 亿行,超过 10 亿个 metrics
每条记录包含:
- 10 个 Tag:hostname, region, datacenter, rack, os, arch, team, service, service_version, service_environment
- 10 个 Field:usage_user, usage_system, usage_idle, usage_nice, usage_iowait, usage_irq, usage_softirq, usage_steal, usage_guest, usage_guest_nice
这是典型的基础设施监控场景:多维标签标识主机,多个指标记录 CPU 使用率。
写入性能
测试参数:batch size 10,000,8 个并发 worker。
| 指标 | TimescaleDB | GreptimeDB | 对比 |
|---|---|---|---|
| 写入速率 | 131,531 rows/sec | 285,301 rows/sec | 2.17x |
| 磁盘占用 | 20 GB | 1.1 GB | 18x 压缩 |
为什么 GreptimeDB 写入更快
列式存储(Parquet 格式):GreptimeDB 使用 Apache Parquet 作为 SST 文件格式,同一列数据连续存放。批量写入时,相同类型数据一次性压缩落盘,减少随机 I/O。
高效压缩:列式存储使同类型数据聚集,压缩率大幅提升。GreptimeDB 针对时序数据可达 30–40 倍压缩率。本次测试中,存储仅为 TimescaleDB 的 1/18,云上部署可显著节省成本。
Mito 存储引擎:GreptimeDB 的 Mito 引擎基于 LSM-Tree 架构,针对时序数据的追加写入模式优化,支持高吞吐写入。
TimescaleDB 基于 PostgreSQL 行式存储,Hypertable 分区和压缩有所帮助,但写入吞吐仍有差距。
查询性能
写入完成后重启数据库,查询多次取平均值。
查询类型说明
| 查询类型 | 含义 | 典型场景 |
|---|---|---|
| cpu-max-all- | N 小时内所有主机所有指标最大值 | 峰值监控 |
| single-groupby-X-Y-Z | X 个指标、Y 台主机、Z 小时聚合 | 下钻分析 |
| double-groupby- | 按时间和主机分组,每小时每主机平均值 | 趋势对比 |
| high-cpu- | CPU 超阈值的主机 | 异常检测 |
| lastpoint | 每台主机最新数据点 | 实时面板 |
| groupby-orderby-limit | 分组排序取 Top N | 排行榜 |
GreptimeDB 胜出(13/15)
| 查询类型 | TimescaleDB (ms) | GreptimeDB (ms) | 提升 |
|---|---|---|---|
| cpu-max-all-8 | 6,012 | 89 | 67x |
| single-groupby-1-1-12 | 571 | 9 | 62x |
| high-cpu-1 | 623 | 16 | 39x |
| single-groupby-1-8-1 | 439 | 20 | 22x |
| cpu-max-all-1 | 411 | 23 | 18x |
| single-groupby-5-1-12 | 166 | 14 | 12x |
| double-groupby-1 | 8,559 | 1,028 | 8.3x |
| single-groupby-1-1-1 | 54 | 7 | 7.7x |
| double-groupby-5 | 7,654 | 1,566 | 4.9x |
| double-groupby-all | 10,717 | 2,270 | 4.7x |
| single-groupby-5-8-1 | 95 | 29 | 3.2x |
| high-cpu-all | 8,731 | 5,661 | 1.5x |
| single-groupby-5-1-1 | 15 | 10 | 1.5x |
TimescaleDB 胜出(2/15)
| 查询类型 | TimescaleDB (ms) | GreptimeDB (ms) | TimescaleDB 优势 |
|---|---|---|---|
| groupby-orderby-limit | 122 | 728 | 6x |
| lastpoint | 131 | 1,131 | 8.7x |
为什么有这些差异
GreptimeDB 优势场景
大时间范围聚合:cpu-max-all-8(8 小时内所有主机所有指标最大值)差距最大,达 67 倍。这类查询扫描大量数据计算聚合,GreptimeDB 优势来自:
列式存储减少 I/O:Parquet 格式只读需要的列,不必读取整行。查询 10 个 CPU 指标列的 I/O 远小于包含所有 Tag 的完整行。
向量化查询引擎:GreptimeDB 基于 Apache DataFusion 构建查询引擎。DataFusion 采用向量化执行模式,一次处理一批数据(而非逐行),充分利用 CPU 缓存局部性。
时间分区和索引:GreptimeDB 按时间窗口组织数据,使用 MinMax、BloomFilter 等索引快速定位时间范围内的数据块,避免全表扫描。
长时间范围单 host:single-groupby-1-1-12(1 指标、1 主机、12 小时)达 62 倍。虽然只查一台主机,但 12 小时意味着 4,320 个数据点(10 秒间隔)。列式存储在这种"窄但长"的模式下优势明显。
短时间范围多 host:single-groupby-1-8-1(1 指标、8 主机、1 小时)达 22 倍。DataFusion 的多线程流式执行引擎并行处理多个时间序列,充分利用多核 CPU。
TimescaleDB 优势场景
lastpoint 查询:获取每台主机最新数据点。TimescaleDB 快 8.7 倍。
这是典型的点查场景。PostgreSQL 的 B-tree 索引对"找某个 key 最新值"有深度优化。
GreptimeDB 还会针对这个场景进一步优化。
groupby-orderby-limit:分组排序取 Top N。TimescaleDB 快 6 倍。
PostgreSQL 在建表时为时间戳列单独建了索引,可以利用该索引加速 ORDER BY + LIMIT 的查询。
性能模式总结
| 查询特征 | 更适合 | 原因 |
|---|---|---|
| 大范围时间聚合 | GreptimeDB | 列式存储 + 向量化执行 |
| 多主机并行扫描 | GreptimeDB | 列式存储减少 I/O |
| 点查询 / 最新值 | TimescaleDB | B-tree 索引优化 |
| Top N 排序 | TimescaleDB | B-tree 索引优化 |
没有数据库在所有场景都最优,选择取决于工作负载。
如何选择
| 场景 | 推荐 | 理由 |
|---|---|---|
| 高吞吐写入(>10 万行/秒) | GreptimeDB | 2.17x 写入 |
| 大时间范围聚合 | GreptimeDB | 最高 67x |
| 存储成本敏感 | GreptimeDB | 18x 压缩 |
| 依赖 PostgreSQL 生态 | TimescaleDB | 完整 SQL 兼容 |
| 频繁 lastpoint 查询 | TimescaleDB | 8.7x 点查优势 |
| Top K 排行榜 | TimescaleDB | 排序更优 |
复现步骤
Ubuntu 24.04 完整复现流程。
1. 安装 Go 并编译 TSBS
bash
# 安装 Go
wget https://go.dev/dl/go1.25.5.linux-amd64.tar.gz
sudo tar -C /usr/local -xzf go1.25.5.linux-amd64.tar.gz
export PATH=$PATH:/usr/local/go/bin

# 验证
go version  # go version go1.25.5 linux/amd64

# 编译 TSBS
git clone https://github.com/GreptimeTeam/tsbs.git
cd tsbs
make

# 准备目录
mkdir -p ~/tsbs-bench/bench-data ~/tsbs-bench/logs
cp -r bin ~/tsbs-bench/
cd ~/tsbs-bench
2. 生成测试数据
bash
# TimescaleDB 格式
./bin/tsbs_generate_data --use-case="cpu-only" --seed=123 --scale=4000 \
    --timestamp-start="2023-06-11T00:00:00Z" \
    --timestamp-end="2023-06-14T00:00:00Z" \
    --log-interval="10s" --format="timescaledb" \
    > ./bench-data/timescaledb-data.csv

# GreptimeDB 格式(InfluxDB Line Protocol)
./bin/tsbs_generate_data --use-case="cpu-only" --seed=123 --scale=4000 \
    --timestamp-start="2023-06-11T00:00:00Z" \
    --timestamp-end="2023-06-14T00:00:00Z" \
    --log-interval="10s" --format="influx" \
    > ./bench-data/influx-data.lp
3. 生成查询文件
bash
QUERY_TYPES=(
    "cpu-max-all-1:100"
    "cpu-max-all-8:100"
    "double-groupby-1:50"
    "double-groupby-5:50"
    "double-groupby-all:50"
    "groupby-orderby-limit:50"
    "high-cpu-1:100"
    "high-cpu-all:50"
    "lastpoint:10"
    "single-groupby-1-1-1:100"
    "single-groupby-1-1-12:100"
    "single-groupby-1-8-1:100"
    "single-groupby-5-1-1:100"
    "single-groupby-5-1-12:100"
    "single-groupby-5-8-1:100"
)

# TimescaleDB
for item in "${QUERY_TYPES[@]}"; do
    IFS=':' read -r qtype count <<< "$item"
    ./bin/tsbs_generate_queries \
        --use-case="devops" --seed=123 --scale=4000 \
        --timestamp-start="2023-06-11T00:00:00Z" \
        --timestamp-end="2023-06-14T00:00:01Z" \
        --queries=$count \
        --query-type $qtype \
        --format="timescaledb" \
        > ./bench-data/timescaledb-queries-${qtype}.dat
done

# GreptimeDB
for item in "${QUERY_TYPES[@]}"; do
    IFS=':' read -r qtype count <<< "$item"
    ./bin/tsbs_generate_queries \
        --use-case="devops" --seed=123 --scale=4000 \
        --timestamp-start="2023-06-11T00:00:00Z" \
        --timestamp-end="2023-06-14T00:00:01Z" \
        --queries=$count \
        --query-type $qtype \
        --format="greptime" \
        > ./bench-data/greptime-queries-${qtype}.dat
done
4. 安装 TimescaleDB
bash
# 依赖
sudo apt install gnupg postgresql-common apt-transport-https lsb-release wget

# PostgreSQL 仓库
sudo /usr/share/postgresql-common/pgdg/apt.postgresql.org.sh

# TimescaleDB 仓库
echo "deb https://packagecloud.io/timescale/timescaledb/ubuntu/ $(lsb_release -c -s) main" \
    | sudo tee /etc/apt/sources.list.d/timescaledb.list
wget --quiet -O - https://packagecloud.io/timescale/timescaledb/gpgkey \
    | sudo gpg --dearmor -o /etc/apt/trusted.gpg.d/timescaledb.gpg

# 安装
sudo apt update
sudo apt install timescaledb-2-postgresql-17 postgresql-client-17

# 调优(默认值)
sudo timescaledb-tune

# 重启并设密码
sudo systemctl restart postgresql
sudo -u postgres psql -c "\password postgres"
# 密码: greptime
5. 安装 GreptimeDB
bash
# 从 https://greptime.com/download 下载
mkdir -p ~/greptimedb-data

# 配置
cat > ~/greptimedb-data/config.toml << 'EOF'
[http]
addr = "0.0.0.0:4000"
timeout = "30s"

[storage]
data_home = "/home/ubuntu/greptimedb-data/data/"
type = "File"
EOF

# 启动
./greptime standalone start -c ~/greptimedb-data/config.toml
6. 写入测试
bash
# TimescaleDB
./bin/tsbs_load_timescaledb \
    --file=./bench-data/timescaledb-data.csv \
    --batch-size=10000 \
    --pass="greptime" \
    --workers=8 2>&1 | tee ./logs/timescaledb-load.log

# GreptimeDB
./bin/tsbs_load_greptime \
    --urls=http://localhost:4000 \
    --file=./bench-data/influx-data.lp \
    --batch-size=10000 \
    --gzip=false \
    --workers=8 2>&1 | tee ./logs/greptime-load.log
7. 查询测试
重启数据库清除缓存后测试:
bash
# 重启 TimescaleDB
sudo systemctl restart postgresql

# TimescaleDB 查询
for qtype in cpu-max-all-1 cpu-max-all-8 double-groupby-1 double-groupby-5 \
    double-groupby-all groupby-orderby-limit high-cpu-1 high-cpu-all \
    lastpoint single-groupby-1-1-1 single-groupby-1-1-12 single-groupby-1-8-1 \
    single-groupby-5-1-1 single-groupby-5-1-12 single-groupby-5-8-1; do
    ./bin/tsbs_run_queries_timescaledb \
        --file=./bench-data/timescaledb-queries-${qtype}.dat \
        --pass="greptime" \
        --db-name=benchmark 2>&1 | tee ./logs/timescaledb-queries-${qtype}.log
done

# 重启 GreptimeDB(停止后重新启动)

# GreptimeDB 查询
for qtype in cpu-max-all-1 cpu-max-all-8 double-groupby-1 double-groupby-5 \
    double-groupby-all groupby-orderby-limit high-cpu-1 high-cpu-all \
    lastpoint single-groupby-1-1-1 single-groupby-1-1-12 single-groupby-1-8-1 \
    single-groupby-5-1-1 single-groupby-5-1-12 single-groupby-5-8-1; do
    ./bin/tsbs_run_queries_influx \
        --file=./bench-data/greptime-queries-${qtype}.dat \
        --db-name=benchmark \
        --urls="http://localhost:4000" 2>&1 | tee ./logs/greptime-queries-${qtype}.log
done
8. 查看结果
提取平均延迟(mean 值,单位 ms):
bash
grep "mean:" ./logs/*.log总结
GreptimeDB 优势:
- 写入 2.17 倍,满足高频采集需求
- 聚合查询 2–67 倍,适合大时间范围分析
- 存储 18 倍压缩,降低云上成本
TimescaleDB 优势:
- lastpoint 查询更快,适合点查
- Top K 排序更优,适合排行榜
- 完整 PostgreSQL 生态兼容
选择取决于工作负载。高吞吐写入和聚合分析选 GreptimeDB;频繁点查或依赖 PostgreSQL 生态选 TimescaleDB。
性能结果受硬件、数据规模、查询模式影响。完整复现步骤已提供,欢迎在自己环境验证。

